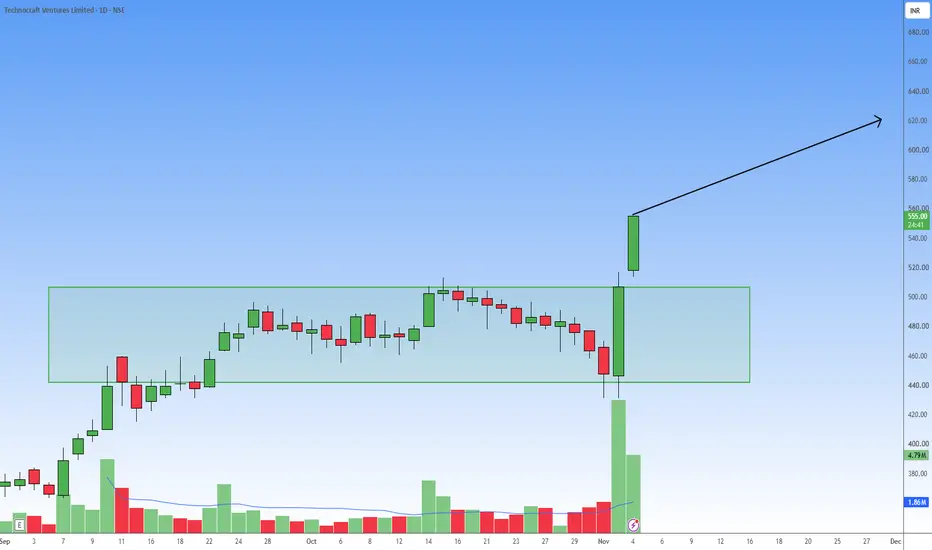
On the daily timeframe, Technocraft Ventures has demonstrated a textbook breakout from a prolonged consolidation phase.
For the past several weeks, the price was range-bound within a distinct rectangular box pattern, fluctuating roughly between the 440 support and 510 resistance levels.
Recently, the stock breached this upper resistance with a highly bullish momentum candle.
The most compelling technical factor supporting this move is the massive surge in trading volume that accompanied the breakout, indicating strong institutional buying interest and validating the strength of the new upward trend.
Here is a potential trade setup based on this technical structure:
Entry Point: Current Market Price (around 548) or ideally on a slight pullback retesting the breakout zone between 510–520.
Target: 600 – 620. (This target is calculated by measuring the height of the consolidation box—approximately 70 points—and projecting it upward from the breakout level, with a secondary momentum target above it).
Stop Loss: 495. Placing the stop loss just below the recent breakout resistance (now turned support) and the psychological 500 mark helps ensure risk is managed if the breakout turns out to be a fake-out.
For the past several weeks, the price was range-bound within a distinct rectangular box pattern, fluctuating roughly between the 440 support and 510 resistance levels.
Recently, the stock breached this upper resistance with a highly bullish momentum candle.
The most compelling technical factor supporting this move is the massive surge in trading volume that accompanied the breakout, indicating strong institutional buying interest and validating the strength of the new upward trend.
Here is a potential trade setup based on this technical structure:
Entry Point: Current Market Price (around 548) or ideally on a slight pullback retesting the breakout zone between 510–520.
Target: 600 – 620. (This target is calculated by measuring the height of the consolidation box—approximately 70 points—and projecting it upward from the breakout level, with a secondary momentum target above it).
Stop Loss: 495. Placing the stop loss just below the recent breakout resistance (now turned support) and the psychological 500 mark helps ensure risk is managed if the breakout turns out to be a fake-out.

Disclaimer
The information and publications are not meant to be, and do not constitute, financial, investment, trading, or other types of advice or recommendations supplied or endorsed by TradingView. Read more in the Terms of Use.
Disclaimer
The information and publications are not meant to be, and do not constitute, financial, investment, trading, or other types of advice or recommendations supplied or endorsed by TradingView. Read more in the Terms of Use.