
TFCILTD Bullish Breakout from Consolidation Phase on Daily
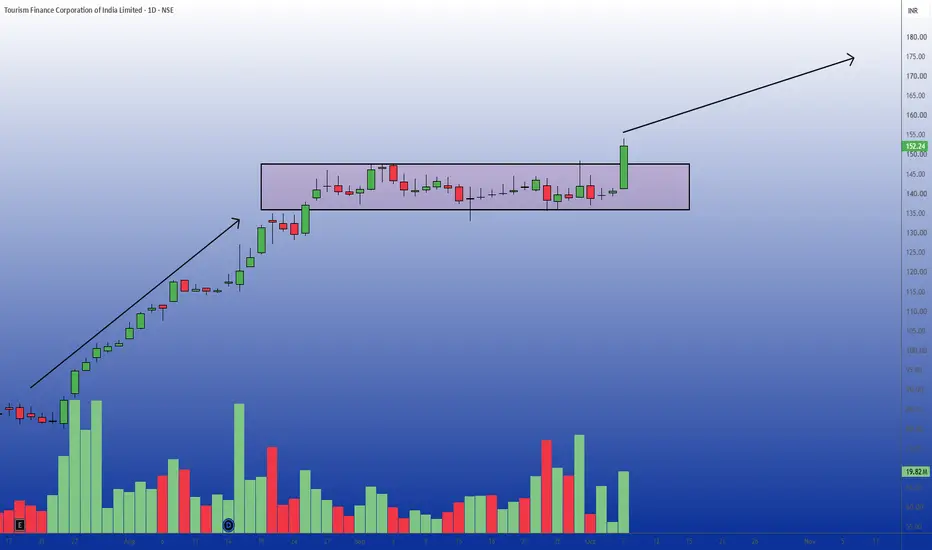
On the daily timeframe, Tourism Finance Corporation of India Limited has demonstrated a strong preceding uptrend, rallying significantly before entering a period of sideways movement.
Over the past several weeks, the price has been consolidating within a well-defined rectangular box, bouncing between structural support near 135 and resistance near 146-147.
In the most recent trading session, a strong bullish candle broke out above the upper boundary of this consolidation zone, closing at 152.24 with an impressive +8.24% gain.
This breakout from a prolonged accumulation phase suggests a high probability of trend continuation.
The visual representation of the upward arrow aligns with the technical expectation that the momentum from the prior flagpole will resume.
Trade Plan:
Entry Point: Current levels around 152, or ideally on a slight pullback/retest of the breakout level between 147 and 150.
Waiting for a retest can offer a better risk-to-reward ratio.
Target: The immediate technical target rests in the 175–180 zone, calculated by projecting the height of the consolidation box (or the preceding bullish leg) upward from the breakout point.
Stop Loss: A strict stop loss should be placed below the bottom of the consolidation box at 134 on a daily closing basis.
Alternatively, aggressive traders can place a tighter stop loss just below the recent swing low or the breakout candle's low near 141 to minimize risk.
Over the past several weeks, the price has been consolidating within a well-defined rectangular box, bouncing between structural support near 135 and resistance near 146-147.
In the most recent trading session, a strong bullish candle broke out above the upper boundary of this consolidation zone, closing at 152.24 with an impressive +8.24% gain.
This breakout from a prolonged accumulation phase suggests a high probability of trend continuation.
The visual representation of the upward arrow aligns with the technical expectation that the momentum from the prior flagpole will resume.
Trade Plan:
Entry Point: Current levels around 152, or ideally on a slight pullback/retest of the breakout level between 147 and 150.
Waiting for a retest can offer a better risk-to-reward ratio.
Target: The immediate technical target rests in the 175–180 zone, calculated by projecting the height of the consolidation box (or the preceding bullish leg) upward from the breakout point.
Stop Loss: A strict stop loss should be placed below the bottom of the consolidation box at 134 on a daily closing basis.
Alternatively, aggressive traders can place a tighter stop loss just below the recent swing low or the breakout candle's low near 141 to minimize risk.

Disclaimer
The information and publications are not meant to be, and do not constitute, financial, investment, trading, or other types of advice or recommendations supplied or endorsed by TradingView. Read more in the Terms of Use.
Disclaimer
The information and publications are not meant to be, and do not constitute, financial, investment, trading, or other types of advice or recommendations supplied or endorsed by TradingView. Read more in the Terms of Use.