
Fundamental Price / Fundamental Data
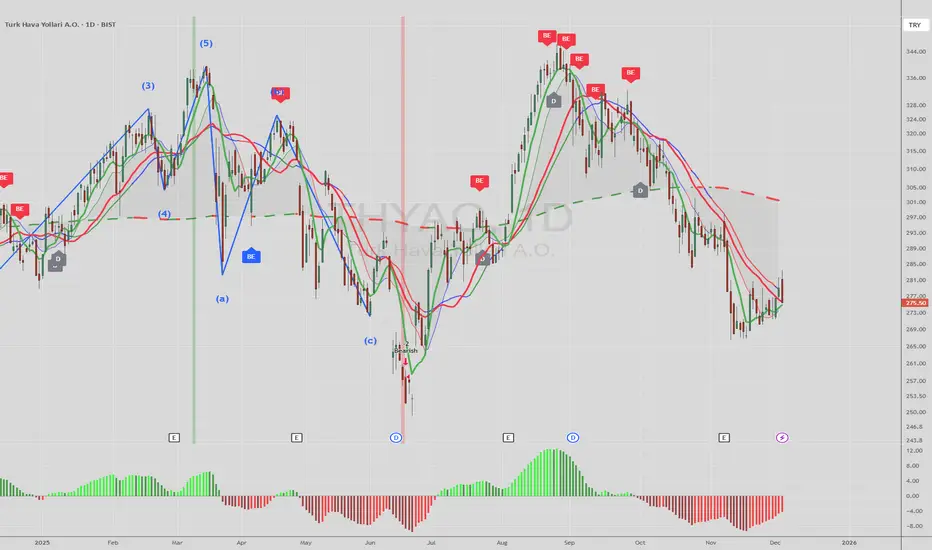
Today’s price: approximately ₺275.50 – ₺279.00 range.
52-week range: ₺249.20 (low) – ₺346.25 (high)
The Price/Earnings (P/E) and Market Value/Book Value (P/B) ratios appear relatively discounted compared to current price levels.
Technical Outlook – Short Term
The price is at the 50-day moving average level, which is a threshold that can technically signal a potential “Buy.”
In the short term, THYAO seems to have found technical support around current levels — this increases the probability of short-term rebound buying. However, some indicators and moving averages remain cautious, which may prevent the price from finding a clear direction.
Some analyses suggest significantly higher target price levels for the stock — for example, ₺478–₺575 range.
Summary
THYAO may be suitable for medium / long-term accumulation, as the price still appears undervalued compared to historical levels, with potential upside.
In the short term, it can be monitored for reaction moves, especially the ₺275–₺280 level, which could act as support — if the price holds this band, a rebound may occur.
Not investment advice (NIA).
Today’s price: approximately ₺275.50 – ₺279.00 range.
52-week range: ₺249.20 (low) – ₺346.25 (high)
The Price/Earnings (P/E) and Market Value/Book Value (P/B) ratios appear relatively discounted compared to current price levels.
Technical Outlook – Short Term
The price is at the 50-day moving average level, which is a threshold that can technically signal a potential “Buy.”
In the short term, THYAO seems to have found technical support around current levels — this increases the probability of short-term rebound buying. However, some indicators and moving averages remain cautious, which may prevent the price from finding a clear direction.
Some analyses suggest significantly higher target price levels for the stock — for example, ₺478–₺575 range.
Summary
THYAO may be suitable for medium / long-term accumulation, as the price still appears undervalued compared to historical levels, with potential upside.
In the short term, it can be monitored for reaction moves, especially the ₺275–₺280 level, which could act as support — if the price holds this band, a rebound may occur.
Not investment advice (NIA).

Disclaimer
The information and publications are not meant to be, and do not constitute, financial, investment, trading, or other types of advice or recommendations supplied or endorsed by TradingView. Read more in the Terms of Use.
Disclaimer
The information and publications are not meant to be, and do not constitute, financial, investment, trading, or other types of advice or recommendations supplied or endorsed by TradingView. Read more in the Terms of Use.