
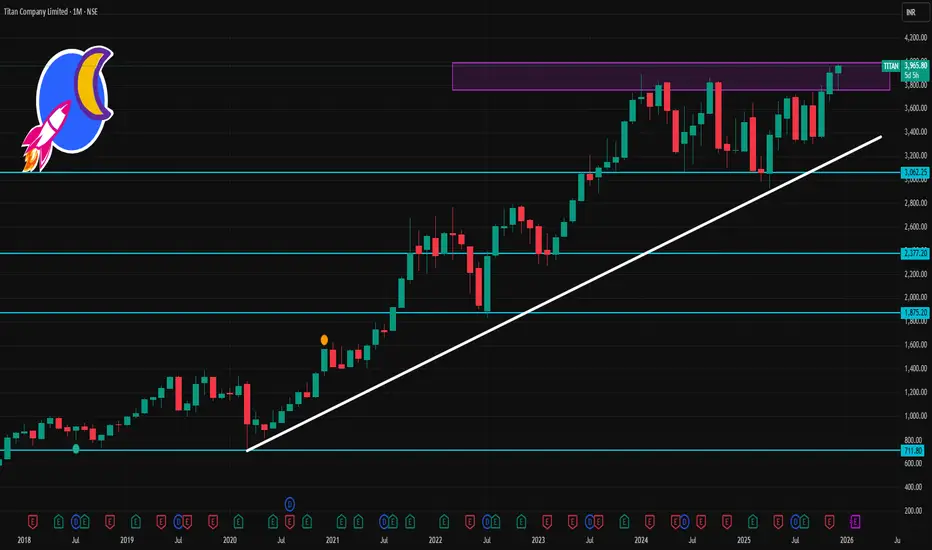
📈 Current Price Context (as of latest market data)
• Titan is trading around ₹3,900‑₹3,925 and recently hit a 52‑week high of ~₹3,962.
• Over the past 1 month, the stock has shown a small positive return (~+0.9% according to Business Today data).
📊 1‑Month Time Frame Key Levels
🔥 Resistance Levels (Potential upside ceilings)
• R1: ~₹3,929–₹3,930
• R2: ~₹3,949–₹3,950
• R3/52W High: ~₹3,962–₹3,964 → a key breakout zone above which the next leg up may begin.
🔻 Support Levels (Potential downside floors)
• S1: ~₹3,894–₹3,895
• S2: ~₹3,879–₹3,880
• S3: ~₹3,859–₹3,860
These are short‑term pivot supports that have shown recent interest on price pullbacks.
Trend Indicators
• Short‑term moving averages (20/50/100/200‑day) are below the current price, suggesting the short/medium trend remains bullish.
• RSI is neutral (~57) — neither overbought nor oversold, giving room for momentum continuation.
⚠️ Notes
📌 These levels are drawn from commonly used technical pivot calculations and recent price action.
📌 Market behavior can shift on macro news, earnings, gold price moves (important for jewellery stocks), or broader index trends.
📌 Always combine with risk management (stop‑loss, position sizing) — technical levels are not guarantees.
• Titan is trading around ₹3,900‑₹3,925 and recently hit a 52‑week high of ~₹3,962.
• Over the past 1 month, the stock has shown a small positive return (~+0.9% according to Business Today data).
📊 1‑Month Time Frame Key Levels
🔥 Resistance Levels (Potential upside ceilings)
• R1: ~₹3,929–₹3,930
• R2: ~₹3,949–₹3,950
• R3/52W High: ~₹3,962–₹3,964 → a key breakout zone above which the next leg up may begin.
🔻 Support Levels (Potential downside floors)
• S1: ~₹3,894–₹3,895
• S2: ~₹3,879–₹3,880
• S3: ~₹3,859–₹3,860
These are short‑term pivot supports that have shown recent interest on price pullbacks.
Trend Indicators
• Short‑term moving averages (20/50/100/200‑day) are below the current price, suggesting the short/medium trend remains bullish.
• RSI is neutral (~57) — neither overbought nor oversold, giving room for momentum continuation.
⚠️ Notes
📌 These levels are drawn from commonly used technical pivot calculations and recent price action.
📌 Market behavior can shift on macro news, earnings, gold price moves (important for jewellery stocks), or broader index trends.
📌 Always combine with risk management (stop‑loss, position sizing) — technical levels are not guarantees.

Contact Knowledgehub for a detailed consultation: Dm on WhatsApp: [wa.link/a2o0kz]-
Phone No: [+91 93102 26243]-
Email: [tradingviewknowledgehub@gmail.com]---
-- Let’s achieve success together!
Phone No: [+91 93102 26243]-
Email: [tradingviewknowledgehub@gmail.com]---
-- Let’s achieve success together!
Related publications
Disclaimer
The information and publications are not meant to be, and do not constitute, financial, investment, trading, or other types of advice or recommendations supplied or endorsed by TradingView. Read more in the Terms of Use.
Contact Knowledgehub for a detailed consultation: Dm on WhatsApp: [wa.link/a2o0kz]-
Phone No: [+91 93102 26243]-
Email: [tradingviewknowledgehub@gmail.com]---
-- Let’s achieve success together!
Phone No: [+91 93102 26243]-
Email: [tradingviewknowledgehub@gmail.com]---
-- Let’s achieve success together!
Related publications
Disclaimer
The information and publications are not meant to be, and do not constitute, financial, investment, trading, or other types of advice or recommendations supplied or endorsed by TradingView. Read more in the Terms of Use.