
Total Crypto Market Cap – Weekly Chart Analysis
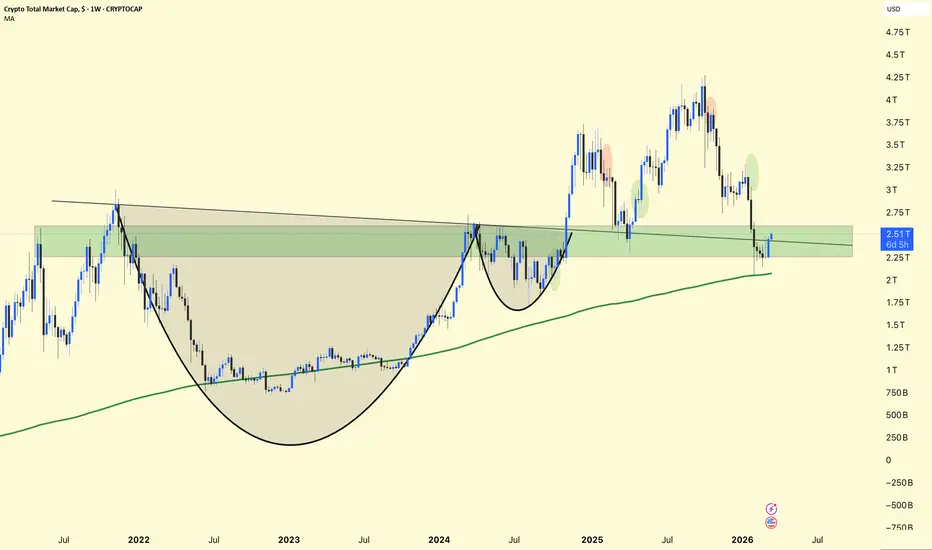
The total crypto market cap is currently around $2.51T and is testing a major historical support–resistance zone near $2.4T–$2.6T. This area previously acted as strong resistance and is now being retested as support.
The chart shows a large, rounded accumulation structure that started after the 2022 bear market.
Price successfully broke above this structure in 2024, triggering a strong rally toward the $4T region.
After the recent correction from the highs, the market is now pulling back to retest the breakout zone, which is a common bullish retest.
The 200-week moving average (green line) is also moving upward and sitting just below the price, adding additional long-term support.
Support: $2.2T – $2.4T
Current Structure: Around $2.5T
Resistance: $3T
Major Resistance: $3.8T – $4T
If the market holds above the $2.3T–$2.4T region, it could confirm a healthy bullish retest and start another move toward $3T and higher.
A strong breakout above $3T would likely bring renewed momentum across the crypto market, potentially pushing the total market cap back toward the $4T zone in the next major expansion phase. 📈
The total crypto market cap is currently around $2.51T and is testing a major historical support–resistance zone near $2.4T–$2.6T. This area previously acted as strong resistance and is now being retested as support.
The chart shows a large, rounded accumulation structure that started after the 2022 bear market.
Price successfully broke above this structure in 2024, triggering a strong rally toward the $4T region.
After the recent correction from the highs, the market is now pulling back to retest the breakout zone, which is a common bullish retest.
The 200-week moving average (green line) is also moving upward and sitting just below the price, adding additional long-term support.
Support: $2.2T – $2.4T
Current Structure: Around $2.5T
Resistance: $3T
Major Resistance: $3.8T – $4T
If the market holds above the $2.3T–$2.4T region, it could confirm a healthy bullish retest and start another move toward $3T and higher.
A strong breakout above $3T would likely bring renewed momentum across the crypto market, potentially pushing the total market cap back toward the $4T zone in the next major expansion phase. 📈

Related publications
Disclaimer
The information and publications are not meant to be, and do not constitute, financial, investment, trading, or other types of advice or recommendations supplied or endorsed by TradingView. Read more in the Terms of Use.
Related publications
Disclaimer
The information and publications are not meant to be, and do not constitute, financial, investment, trading, or other types of advice or recommendations supplied or endorsed by TradingView. Read more in the Terms of Use.