 TRENT
TRENT TRENT (NSE) – Daily Timeframe
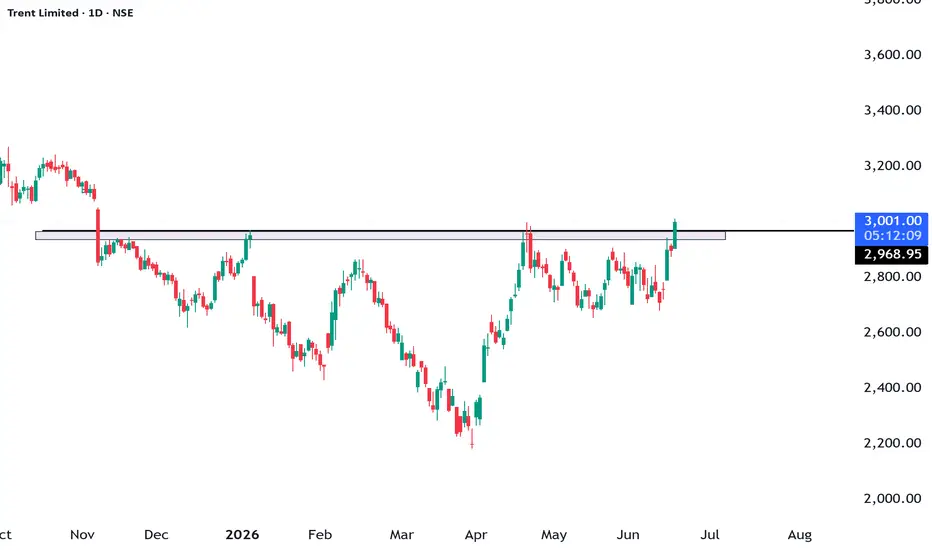
TRENT has finally broken above a key resistance zone around ₹2,950–2,970, a level that has acted as a supply area multiple times over the last several months.
Key Observations
✅ Multiple historical rejections from the highlighted zone.
✅ Strong bullish candle closing above resistance.
✅ Higher lows are forming, indicating accumulation.
✅ Potential transition from consolidation to trending move.
Bullish Scenario
If the price sustains above the breakout zone, the stock may continue its upward momentum with the possibility of testing higher resistance levels in the coming weeks.
What I'll Be Watching
• Follow-through buying above the breakout level.
• Volume confirmation on subsequent sessions.
• Retest of the breakout zone acting as support.
Risk
A close back below the breakout area could indicate a false breakout and may lead to renewed selling pressure.
==============
⚠️ Disclaimer:
==============
This content is shared strictly for educational and informational purposes.
We are not SEBI-registered investment advisors or analysts.
The views expressed are personal opinions, based on publicly available data and market observations.
Please consult a SEBI-registered investment advisor before taking any investment or trading decisions.
Any actions taken based on this content are entirely at your own risk and responsibility.
========================
Trade Secrets By Pratik
========================

Prattik Lodha
Disclaimer
The information and publications are not meant to be, and do not constitute, financial, investment, trading, or other types of advice or recommendations supplied or endorsed by TradingView. Read more in the Terms of Use.
Prattik Lodha
Disclaimer
The information and publications are not meant to be, and do not constitute, financial, investment, trading, or other types of advice or recommendations supplied or endorsed by TradingView. Read more in the Terms of Use.