
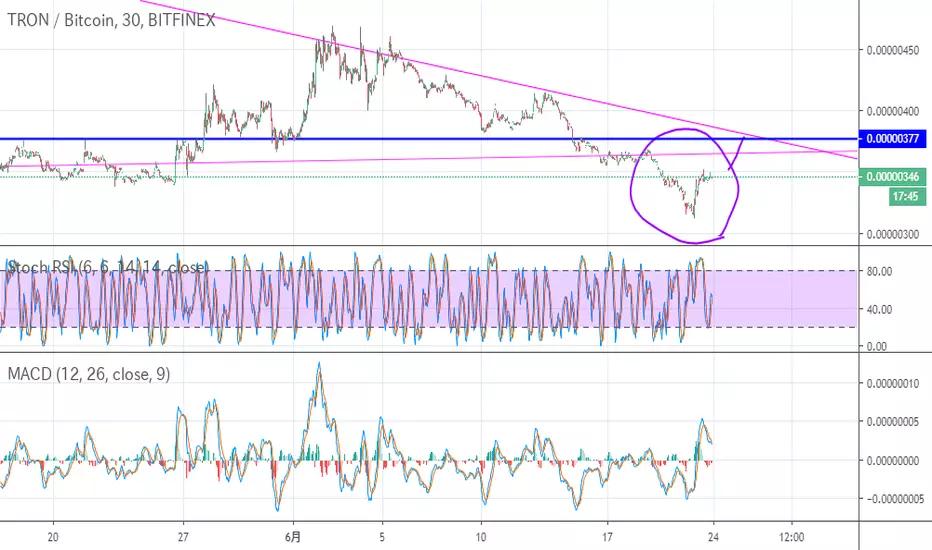
日足での2本のラインが交わるところまでは↓目線。
短期の上昇を確認。
BLUEのラインまで。
短期の上昇を確認。
BLUEのラインまで。

Disclaimer
The information and publications are not meant to be, and do not constitute, financial, investment, trading, or other types of advice or recommendations supplied or endorsed by TradingView. Read more in the Terms of Use.
Disclaimer
The information and publications are not meant to be, and do not constitute, financial, investment, trading, or other types of advice or recommendations supplied or endorsed by TradingView. Read more in the Terms of Use.