
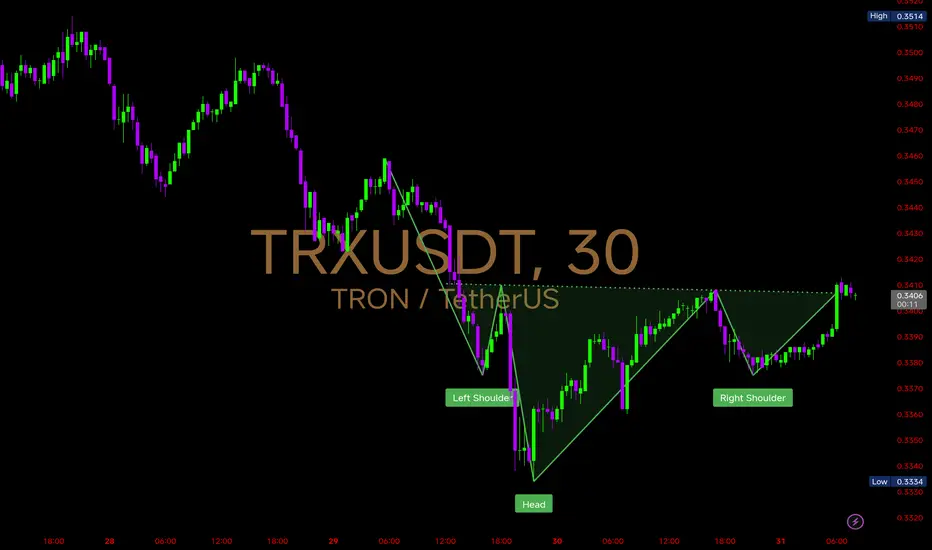
 TRX on the 30mins chart has formed a clear Inverse Head & Shoulders pattern ✅
🔹 Left Shoulder – 0.338
🔹 Head – 0.333
🔹 Right Shoulder – 0.337
🔹 Breakout neckline – around 0.341
✅ If price sustains above the neckline (0.341), momentum could push #TRX toward 0.345 → 0.351 → 0.360 in short-term.
⚠️ If it fails to hold, we may retest supports at 0.337 → 0.333.
Inverse H&S is typically a bullish reversal pattern, so watch for volume confirmation — if buyers step in, price could deliver a strong upside breakout.

Disclaimer
The information and publications are not meant to be, and do not constitute, financial, investment, trading, or other types of advice or recommendations supplied or endorsed by TradingView. Read more in the Terms of Use.
Disclaimer
The information and publications are not meant to be, and do not constitute, financial, investment, trading, or other types of advice or recommendations supplied or endorsed by TradingView. Read more in the Terms of Use.