
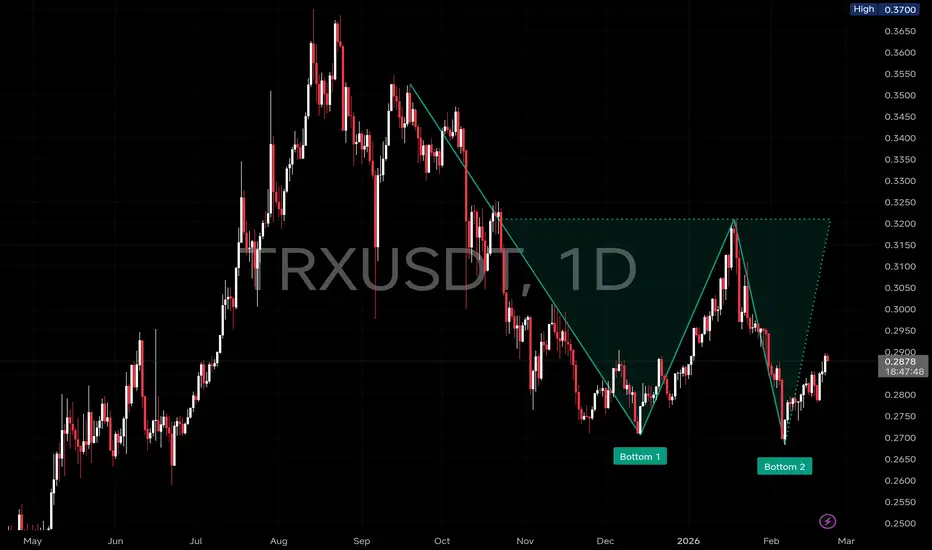
 TRX is shaping a potential double bottom structure on the daily timeframe after a prolonged correction from the 0.37 highs. Price is currently trading around 0.288, attempting to reclaim momentum after defending the 0.27–0.275 region twice.
The neckline zone sits around 0.321 . That level rejected the last bounce and remains the key barrier. A daily close and acceptance above 0.321 would confirm strength and open room toward 0.34, followed by 0.36–0.37 if continuation builds.
As long as price holds above 0.27, the structure remains constructive. That zone is clearly absorbing sell pressure.
However, a breakdown and daily close below 0.27 invalidates the double bottom idea and likely exposes 0.255–0.25 next.
Follow Crypto Sat 🟨

Disclaimer
The information and publications are not meant to be, and do not constitute, financial, investment, trading, or other types of advice or recommendations supplied or endorsed by TradingView. Read more in the Terms of Use.
Disclaimer
The information and publications are not meant to be, and do not constitute, financial, investment, trading, or other types of advice or recommendations supplied or endorsed by TradingView. Read more in the Terms of Use.