
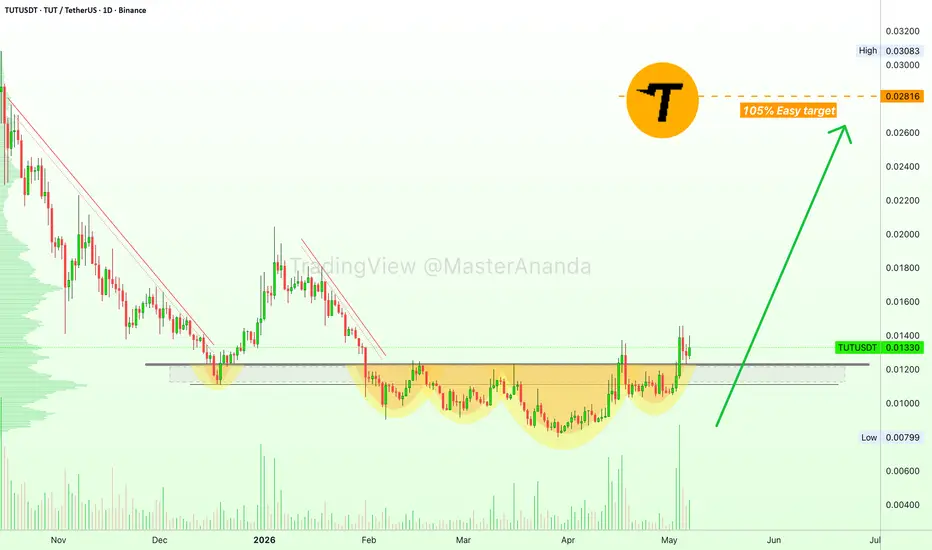
Here we have a dividing line between bears and bulls, the bearish and bullish zone, right around 0.1200. Below this line TUTUSDT wasn't really trending but more like consolidating. Above this line, a change of trend can develop. Notice how trading volume has been rising steadily for the past five months. Notice the size of the green bars vs the red ones. Accumulation has been taking place. Now that the action has recovered above the long-term bottom, we can expect a nice jump. This is a short-term trade setup and we are aiming for a nice and easy 100%. The target can be seen on the chart. This level can hit within several weeks just as it can take only a few days. It depends on when the market force reaches this project. The bulls have the upper-hand.
Namaste.
Namaste.

✅ Cryptocurrencies technical analysis & results
t.me/masteranandatrades/9279
✅ Stocks technical analysis
t.me/anandastocks
✅ Enjoyed the content? Join my PREMIUM channels for more... t.me/lamatrades/4 (since 2017)
t.me/masteranandatrades/9279
✅ Stocks technical analysis
t.me/anandastocks
✅ Enjoyed the content? Join my PREMIUM channels for more... t.me/lamatrades/4 (since 2017)
Related publications
Disclaimer
The information and publications are not meant to be, and do not constitute, financial, investment, trading, or other types of advice or recommendations supplied or endorsed by TradingView. Read more in the Terms of Use.
✅ Cryptocurrencies technical analysis & results
t.me/masteranandatrades/9279
✅ Stocks technical analysis
t.me/anandastocks
✅ Enjoyed the content? Join my PREMIUM channels for more... t.me/lamatrades/4 (since 2017)
t.me/masteranandatrades/9279
✅ Stocks technical analysis
t.me/anandastocks
✅ Enjoyed the content? Join my PREMIUM channels for more... t.me/lamatrades/4 (since 2017)
Related publications
Disclaimer
The information and publications are not meant to be, and do not constitute, financial, investment, trading, or other types of advice or recommendations supplied or endorsed by TradingView. Read more in the Terms of Use.