1. Executive Summary & Market Assessment
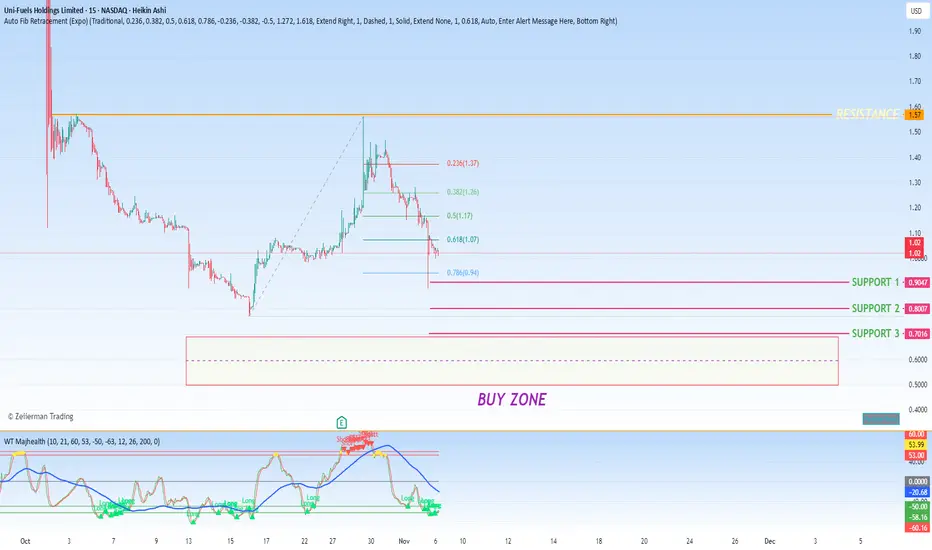
The current technical setup for UFG presents a high-risk, high-reward opportunity. The price action is currently defined by clear, descending support levels, with a significant Fibonacci retracement pattern completing on the lower-timeframe (15-minute) chart. The strategy is one of extreme patience, awaiting a confirmed bullish reversal at a deep support zone between 5000 and 7000. This trade will only be activated upon a critical confluence of price level and bullish volume confirmation, acknowledging the substantial risk involved.
2. Analysis of Current Structure & Key Levels
Hierarchical Support: The price is navigating a series of defined support levels at 9000, 8000, and the critical 7000. Each breach of a higher support level indicates sustained selling pressure. The 7000 level is the final key defensive line before a potentially steeper decline.
Fibonacci Retracement Context: The observation that the "Fib retracement has been filled on the 15-minute timeframe" suggests that a measured move down from a recent high has reached its full, typical extension. This often creates a technical environment where a short-term bounce or reversal is possible, as the momentum of the sell-off may be exhausted.
3. Defined Trade Thesis & Entry Trigger
The core of the strategy is not to predict the bottom, but to wait for the market to show its hand through clear signals of a trend change.
Accumulation Zone (Buy Zone): 5000 - 7000
This wide range is identified as a potential value area and a technical support cluster where long-term buyers are expected to step in. It is the area of interest, but not an automatic trigger to buy.
The Critical Confirmation Signal: Volume Surge
The most crucial component of this plan is the requirement for a significant increase in buying volume. In a vacuum, a price bouncing in the 5000-7000 zone could be a temporary respite, or a "dead cat bounce." A sustained surge in volume is the key differentiator—it provides the evidence that institutional money or a critical mass of buyers is committing capital, validating the reversal.
What to Look For: A volume bar that is significantly larger than the average of the preceding bars, coinciding with a strong bullish candlestick that closes near its high.
4. Risk Disclosure & Strategic Patience
Inherent Risk Profile: This trade is correctly classified as "very risky."UFG is exhibiting bearish market structure, and attempting to catch a falling knife is inherently dangerous. The deep buy zone implies a recognition that the current downtrend could have significant further to go.
The Discipline of Waiting: The plan explicitly avoids front-running the bottom. The instruction is to "wait for the volume to increase to be sure we are bullish." This discipline is the primary risk-management tool. It ensures capital is only deployed when the probability of success is highest, even if it means missing the absolute lowest tick.
Conclusion:
In summary, the plan forUFG is a calculated speculation on a trend reversal at a deep support level. It is not an active trade but a watchlist setup waiting for specific conditions to align. The sequence is critical:
Price must first decline into the 5000-7000 buy zone.
From within this zone, clear evidence of buyer commitment must appear in the form of a sustained increase in volume.
Only upon the confluence of these two factors would a long position be considered.
This methodical approach transforms a risky gamble into a structured, rule-based trade, where the primary edge comes from patience and confirmation.
The current technical setup for
UFG presents a high-risk, high-reward opportunity. The price action is currently defined by clear, descending support levels, with a significant Fibonacci retracement pattern completing on the lower-timeframe (15-minute) chart. The strategy is one of extreme patience, awaiting a confirmed bullish reversal at a deep support zone between 5000 and 7000. This trade will only be activated upon a critical confluence of price level and bullish volume confirmation, acknowledging the substantial risk involved.2. Analysis of Current Structure & Key Levels
Hierarchical Support: The price is navigating a series of defined support levels at 9000, 8000, and the critical 7000. Each breach of a higher support level indicates sustained selling pressure. The 7000 level is the final key defensive line before a potentially steeper decline.
Fibonacci Retracement Context: The observation that the "Fib retracement has been filled on the 15-minute timeframe" suggests that a measured move down from a recent high has reached its full, typical extension. This often creates a technical environment where a short-term bounce or reversal is possible, as the momentum of the sell-off may be exhausted.
3. Defined Trade Thesis & Entry Trigger
The core of the strategy is not to predict the bottom, but to wait for the market to show its hand through clear signals of a trend change.
Accumulation Zone (Buy Zone): 5000 - 7000
This wide range is identified as a potential value area and a technical support cluster where long-term buyers are expected to step in. It is the area of interest, but not an automatic trigger to buy.
The Critical Confirmation Signal: Volume Surge
The most crucial component of this plan is the requirement for a significant increase in buying volume. In a vacuum, a price bouncing in the 5000-7000 zone could be a temporary respite, or a "dead cat bounce." A sustained surge in volume is the key differentiator—it provides the evidence that institutional money or a critical mass of buyers is committing capital, validating the reversal.
What to Look For: A volume bar that is significantly larger than the average of the preceding bars, coinciding with a strong bullish candlestick that closes near its high.
4. Risk Disclosure & Strategic Patience
Inherent Risk Profile: This trade is correctly classified as "very risky."
UFG is exhibiting bearish market structure, and attempting to catch a falling knife is inherently dangerous. The deep buy zone implies a recognition that the current downtrend could have significant further to go.The Discipline of Waiting: The plan explicitly avoids front-running the bottom. The instruction is to "wait for the volume to increase to be sure we are bullish." This discipline is the primary risk-management tool. It ensures capital is only deployed when the probability of success is highest, even if it means missing the absolute lowest tick.
Conclusion:
In summary, the plan for
UFG is a calculated speculation on a trend reversal at a deep support level. It is not an active trade but a watchlist setup waiting for specific conditions to align. The sequence is critical:Price must first decline into the 5000-7000 buy zone.
From within this zone, clear evidence of buyer commitment must appear in the form of a sustained increase in volume.
Only upon the confluence of these two factors would a long position be considered.
This methodical approach transforms a risky gamble into a structured, rule-based trade, where the primary edge comes from patience and confirmation.
Trade closed: target reached
Bounced back up perfectly from support 1
Disclaimer
The information and publications are not meant to be, and do not constitute, financial, investment, trading, or other types of advice or recommendations supplied or endorsed by TradingView. Read more in the Terms of Use.
Disclaimer
The information and publications are not meant to be, and do not constitute, financial, investment, trading, or other types of advice or recommendations supplied or endorsed by TradingView. Read more in the Terms of Use.