
This post is educational and observational in nature based on historical price action on the monthly timeframe. It is not a forecast or a trading recommendation. Using 3 months old charts only
The Monthly Trendline
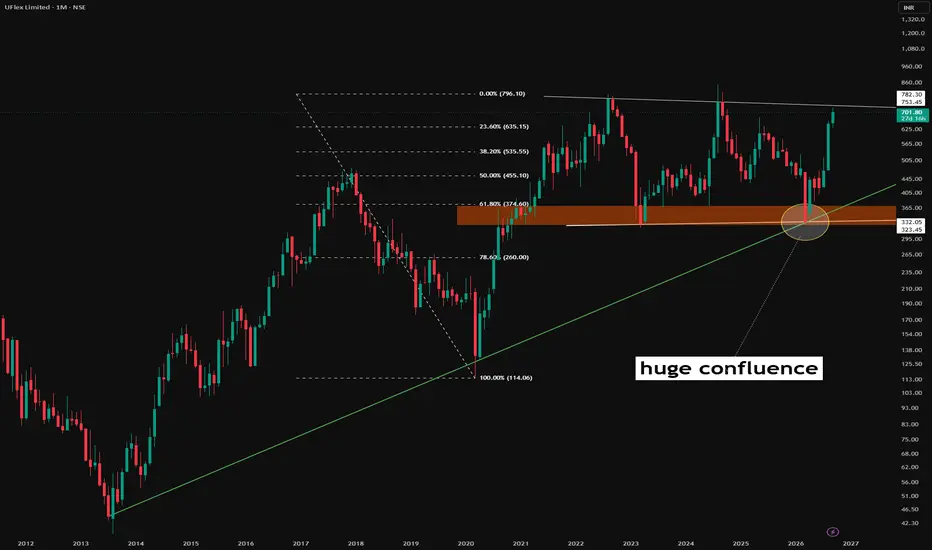
A trendline drawn on the monthly timeframe carries significant structural weight, since it reflects price behavior compressed across years rather than days or weeks. In this chart, the green trendline originates from 2014, touches the market bottom again in 2020, and is respected once more in 2025. A trendline holding across three separate touches spanning more than a decade demonstrates a level of consistency that shorter timeframe lines rarely show.
The Rally From the 2020 Bottom
From the 2020 low, the stock delivered a strong rally, forming a higher high and breaking out of its prior structure by 2021. Since markets cannot sustain a purely vertical move indefinitely, this rally was followed by an extended period of sideways consolidation.
The Fibonacci Retracement and the Golden Zone
A Fibonacci retracement tool was applied from the swing low to the swing high of that 2020 to 2021 rally. Within this tool, the 61.8% level, marked in gold, represents the golden retracement zone, one of the more closely watched levels in technical analysis, often where corrective moves find their footing.
The Symmetrical Triangle
Marked with white lines, a symmetrical triangle pattern formed between 2023 and 2024 on the monthly timeframe, defined by converging lower highs and higher lows compressing into a tighter range over this period.
The Confluence
The most notable observation on this chart is where these separate elements converge. The decade spanning trendline, the lower support line of the symmetrical triangle, and the 61.8% golden retracement zone all align at the same area. This overlap of three independently derived technical references at a single point is what is referred to as confluence, and when multiple tools point to the same zone, that area tends to carry more observational significance than any single line or level would on its own.
The Monthly Trendline
A trendline drawn on the monthly timeframe carries significant structural weight, since it reflects price behavior compressed across years rather than days or weeks. In this chart, the green trendline originates from 2014, touches the market bottom again in 2020, and is respected once more in 2025. A trendline holding across three separate touches spanning more than a decade demonstrates a level of consistency that shorter timeframe lines rarely show.
The Rally From the 2020 Bottom
From the 2020 low, the stock delivered a strong rally, forming a higher high and breaking out of its prior structure by 2021. Since markets cannot sustain a purely vertical move indefinitely, this rally was followed by an extended period of sideways consolidation.
The Fibonacci Retracement and the Golden Zone
A Fibonacci retracement tool was applied from the swing low to the swing high of that 2020 to 2021 rally. Within this tool, the 61.8% level, marked in gold, represents the golden retracement zone, one of the more closely watched levels in technical analysis, often where corrective moves find their footing.
The Symmetrical Triangle
Marked with white lines, a symmetrical triangle pattern formed between 2023 and 2024 on the monthly timeframe, defined by converging lower highs and higher lows compressing into a tighter range over this period.
The Confluence
The most notable observation on this chart is where these separate elements converge. The decade spanning trendline, the lower support line of the symmetrical triangle, and the 61.8% golden retracement zone all align at the same area. This overlap of three independently derived technical references at a single point is what is referred to as confluence, and when multiple tools point to the same zone, that area tends to carry more observational significance than any single line or level would on its own.

📊Swing & positional research with Buy, Sell & Hold recommendations
Contact for NOVEMBER SLOTS
📞WhatsApp ( Pro ): wa.me/919455664601
📢Free Picks on Telegram ( Join ) : t.me/hashtaghammer
Apoorv Dubey|SEBI RA INH000030287
Contact for NOVEMBER SLOTS
📞WhatsApp ( Pro ): wa.me/919455664601
📢Free Picks on Telegram ( Join ) : t.me/hashtaghammer
Apoorv Dubey|SEBI RA INH000030287
Related publications
Disclaimer
The information and publications are not meant to be, and do not constitute, financial, investment, trading, or other types of advice or recommendations supplied or endorsed by TradingView. Read more in the Terms of Use.
📊Swing & positional research with Buy, Sell & Hold recommendations
Contact for NOVEMBER SLOTS
📞WhatsApp ( Pro ): wa.me/919455664601
📢Free Picks on Telegram ( Join ) : t.me/hashtaghammer
Apoorv Dubey|SEBI RA INH000030287
Contact for NOVEMBER SLOTS
📞WhatsApp ( Pro ): wa.me/919455664601
📢Free Picks on Telegram ( Join ) : t.me/hashtaghammer
Apoorv Dubey|SEBI RA INH000030287
Related publications
Disclaimer
The information and publications are not meant to be, and do not constitute, financial, investment, trading, or other types of advice or recommendations supplied or endorsed by TradingView. Read more in the Terms of Use.