UK 100 ( UK100) Daily: Overhead Supply Friction at 10,935 All-Time High Triggers Consolidation Around Record Ceiling
### 🇬🇧 FTSE 100 Index (UK100) Daily Technical Framework (Ref: UK100_2026-08-05_08-47-07.png)
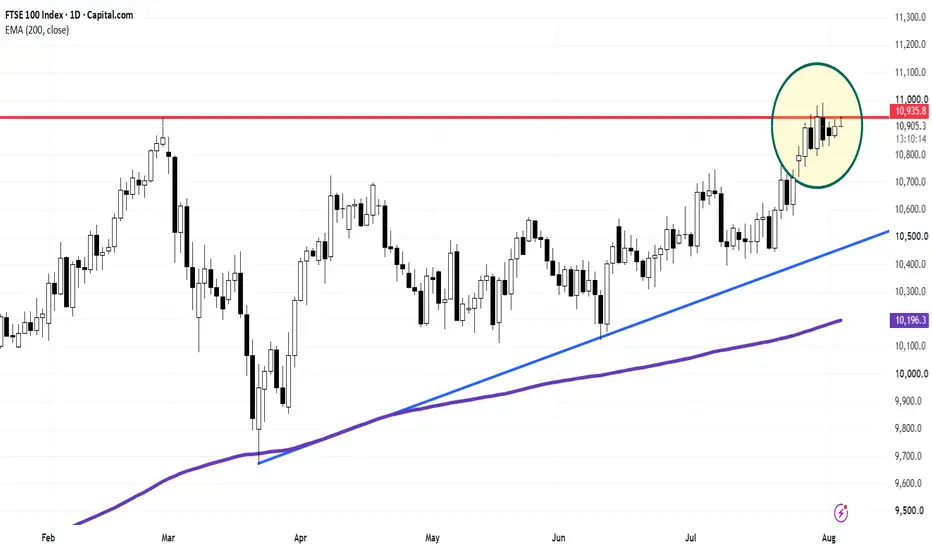
We are releasing an updated Daily (1D) structural matrix on the UK FTSE 100 Index (UK100). Following an aggressive impulse toward record highs, price action has entered a distinct phase of hesitation and overhead supply absorption directly against the primary historical resistance barrier.
The benchmark index is trading essentially flat today at **10,910.6 (+0.06%)**, remaining locked in a tight consolidation structure inside the highlighted yellow zone.
---
### 🔍 Technical Architecture & ATH Friction Dynamics:
Our quantitative setup highlights clear microstructural friction at record levels:
1. **Overhead Supply Friction (Yellow Circle):** Despite probing above the major horizontal resistance ceiling at **10,935.8**, bullish momentum has stalled. The accumulation of small-bodied candles and upper wicks within the highlighted yellow node signals strong sell-side absorption and a temporary lack of follow-through volume.
2. **Key Psychological Wall:** The **11,000.0** psychological handle continues to act as a formidable barrier, preventing buyers from confirming a clean trend-expansion breakout.
3. **Ascending Baseline Support (Blue LTA):** The broader bullish market structure remains fully intact, anchored by the long-term ascending trendline (blue LTA line) rising toward **10,500.0**, well clear of the institutional **200-period EMA (purple line at 10,196.4)**.
---
### 🛡️ Strategic Operational Scenarios:
* **Scenario A — Delayed Breakout & Acceptance Above ATH:** A strong daily expansion candle closing decisively above **10,935.8 – 10,950.0** is required to absorb supply, opening the path for a sustained run beyond the **11,000.0** milestone.
* **Scenario B — Mean Reversion Pullback:** Failure to breach resistance will likely trigger a corrective profit-taking leg, pulling price action back down to retest the blue ascending trendline support near **10,500.0** to gather fresh liquidity.
### 📊 Tactical Parameters Summary:
* **Current Bias:** Neutral / High-Level Consolidation & Supply Friction
* **Major Overhead Resistance Ceiling:** 10,935.8 – 11,000.0
* **Immediate Consolidation Range:** 10,850.0 – 10,950.0
* **Primary Trendline Base Support (Blue LTA):** ~10,500.0
* **Institutional Risk Baseline (200-EMA):** 10,196.4
---
📊 **ChartPro Data**
*UK Equity Architecture, All-Time High Microstructure & Systematic Risk Management.*
⚠️ **Disclaimer:** For educational and informational purposes only. This active market study represents a personal trading framework and does not constitute financial or investment advice.
UK100) Daily: Overhead Supply Friction at 10,935 All-Time High Triggers Consolidation Around Record Ceiling### 🇬🇧 FTSE 100 Index (
UK100) Daily Technical Framework (Ref: UK100_2026-08-05_08-47-07.png)We are releasing an updated Daily (1D) structural matrix on the UK FTSE 100 Index (
UK100). Following an aggressive impulse toward record highs, price action has entered a distinct phase of hesitation and overhead supply absorption directly against the primary historical resistance barrier.The benchmark index is trading essentially flat today at **10,910.6 (+0.06%)**, remaining locked in a tight consolidation structure inside the highlighted yellow zone.
---
### 🔍 Technical Architecture & ATH Friction Dynamics:
Our quantitative setup highlights clear microstructural friction at record levels:
1. **Overhead Supply Friction (Yellow Circle):** Despite probing above the major horizontal resistance ceiling at **10,935.8**, bullish momentum has stalled. The accumulation of small-bodied candles and upper wicks within the highlighted yellow node signals strong sell-side absorption and a temporary lack of follow-through volume.
2. **Key Psychological Wall:** The **11,000.0** psychological handle continues to act as a formidable barrier, preventing buyers from confirming a clean trend-expansion breakout.
3. **Ascending Baseline Support (Blue LTA):** The broader bullish market structure remains fully intact, anchored by the long-term ascending trendline (blue LTA line) rising toward **10,500.0**, well clear of the institutional **200-period EMA (purple line at 10,196.4)**.
---
### 🛡️ Strategic Operational Scenarios:
* **Scenario A — Delayed Breakout & Acceptance Above ATH:** A strong daily expansion candle closing decisively above **10,935.8 – 10,950.0** is required to absorb supply, opening the path for a sustained run beyond the **11,000.0** milestone.
* **Scenario B — Mean Reversion Pullback:** Failure to breach resistance will likely trigger a corrective profit-taking leg, pulling price action back down to retest the blue ascending trendline support near **10,500.0** to gather fresh liquidity.
### 📊 Tactical Parameters Summary:
* **Current Bias:** Neutral / High-Level Consolidation & Supply Friction
* **Major Overhead Resistance Ceiling:** 10,935.8 – 11,000.0
* **Immediate Consolidation Range:** 10,850.0 – 10,950.0
* **Primary Trendline Base Support (Blue LTA):** ~10,500.0
* **Institutional Risk Baseline (200-EMA):** 10,196.4
---
📊 **ChartPro Data**
*UK Equity Architecture, All-Time High Microstructure & Systematic Risk Management.*
⚠️ **Disclaimer:** For educational and informational purposes only. This active market study represents a personal trading framework and does not constitute financial or investment advice.

Disclaimer
The information and publications are not meant to be, and do not constitute, financial, investment, trading, or other types of advice or recommendations supplied or endorsed by TradingView. Read more in the Terms of Use.
Disclaimer
The information and publications are not meant to be, and do not constitute, financial, investment, trading, or other types of advice or recommendations supplied or endorsed by TradingView. Read more in the Terms of Use.