
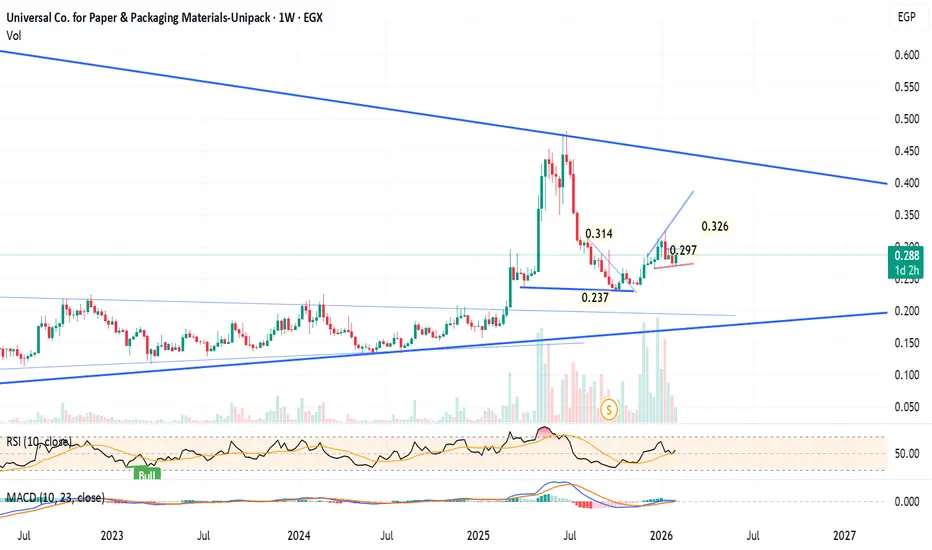
Weekly chart
Technical analysis and advice for Universal for Paper and Packaging Materials (UNIP) on the Egyptian Stock Market (EGX) is detailed below:
Executive Summary: Technical Advice
Recommendation: Accumulate / Buy on Dips The stock is currently in a positive technical trend following a major price adjustment caused by a stock dividend (free shares) in late 2025. While some investors in social groups express frustration due to the lower nominal price, the technical indicators suggest strong momentum and accumulation.
1. Important Context: The "Price Drop" Misconception
If you see comments on Facebook groups complaining that the stock "crashed" from 0.80+ to the 0.20s, it is crucial to understand this was not a loss in value but a corporate action.
Event: On September 24-25, 2025, the company distributed 2 free shares for every 1 original share (a 3:1 split effect).
Impact: This naturally divided the share price by roughly 3. The current price of ~0.29 EGP is technically equivalent to the old ~0.87 EGP. The stock is essentially trading near its pre-split highs, which is a bullish sign.
2. Technical Indicators Analysis
The automated technical readings are overwhelmingly positive:
Trend: Bullish (Upward). The stock is trading above its key Moving Averages (5, 10, 20, 50, and 100-day), signaling a strong short-to-medium-term uptrend.
RSI (Relative Strength Index): ~70 (High/Overbought Border). This indicates very strong buying momentum. While it suggests the stock is "expensive" in the very short term, in strong trends, an RSI > 70 often signals a breakout rather than a reversal.
MACD (Moving Average Convergence Divergence): Positive. The MACD line is above the signal line, confirming the bullish momentum is still active.
Volume: Trading volumes have been healthy, indicating genuine interest from buyers at these new price levels.
3. Key Chart Levels (Support & Resistance)
Based on the post-split price action:
Current Price: ~0.292 EGP
Resistance (Target) 1: 0.305 EGP (Psychological barrier and recent high).
Resistance (Target) 2: 0.320 - 0.330 EGP (Extension target if 0.30 is broken with volume).
Support (Buy Zone): 0.282 - 0.285 EGP. This is the "floor" the stock has recently established.
Stop Loss: Below 0.270 EGP. A close below this level would invalidate the current bullish setup.
4. Social Sentiment (Facebook & Forums)
The "Trapped" Investor: Many retail investors on forums who bought at "highs" before the split often feel "stuck" because they see the price as 0.29 vs. their buy price of 1.00+, forgetting they now own 3x more shares. Ignore the panic from these comments; their "loss" is likely psychological rather than realized if adjusted for the split.
The Smart Money: Experienced traders are viewing the 0.28 - 0.29 zone as an accumulation phase, expecting the stock to eventually re-test the equivalent of its old highs (which would be ~0.40 - 0.50 in current terms over the long run).
5. Trading Plan & Advice
For Short-Term Traders: Look for entries as close to 0.285 as possible. Take profit partially at 0.305 and leave the rest for a potential breakout. Watch volume closely at 0.30; if it breaks with high volume, the rally could extend quickly.
For Investors: The stock is financially stable with recent capital increases. Hold your position if you already own it. If the price dips to 0.275, it is a strong "Buy" opportunity.
Note: AI generated based on my thoughtful prompt.
Technical analysis and advice for Universal for Paper and Packaging Materials (UNIP) on the Egyptian Stock Market (EGX) is detailed below:
Executive Summary: Technical Advice
Recommendation: Accumulate / Buy on Dips The stock is currently in a positive technical trend following a major price adjustment caused by a stock dividend (free shares) in late 2025. While some investors in social groups express frustration due to the lower nominal price, the technical indicators suggest strong momentum and accumulation.
1. Important Context: The "Price Drop" Misconception
If you see comments on Facebook groups complaining that the stock "crashed" from 0.80+ to the 0.20s, it is crucial to understand this was not a loss in value but a corporate action.
Event: On September 24-25, 2025, the company distributed 2 free shares for every 1 original share (a 3:1 split effect).
Impact: This naturally divided the share price by roughly 3. The current price of ~0.29 EGP is technically equivalent to the old ~0.87 EGP. The stock is essentially trading near its pre-split highs, which is a bullish sign.
2. Technical Indicators Analysis
The automated technical readings are overwhelmingly positive:
Trend: Bullish (Upward). The stock is trading above its key Moving Averages (5, 10, 20, 50, and 100-day), signaling a strong short-to-medium-term uptrend.
RSI (Relative Strength Index): ~70 (High/Overbought Border). This indicates very strong buying momentum. While it suggests the stock is "expensive" in the very short term, in strong trends, an RSI > 70 often signals a breakout rather than a reversal.
MACD (Moving Average Convergence Divergence): Positive. The MACD line is above the signal line, confirming the bullish momentum is still active.
Volume: Trading volumes have been healthy, indicating genuine interest from buyers at these new price levels.
3. Key Chart Levels (Support & Resistance)
Based on the post-split price action:
Current Price: ~0.292 EGP
Resistance (Target) 1: 0.305 EGP (Psychological barrier and recent high).
Resistance (Target) 2: 0.320 - 0.330 EGP (Extension target if 0.30 is broken with volume).
Support (Buy Zone): 0.282 - 0.285 EGP. This is the "floor" the stock has recently established.
Stop Loss: Below 0.270 EGP. A close below this level would invalidate the current bullish setup.
4. Social Sentiment (Facebook & Forums)
The "Trapped" Investor: Many retail investors on forums who bought at "highs" before the split often feel "stuck" because they see the price as 0.29 vs. their buy price of 1.00+, forgetting they now own 3x more shares. Ignore the panic from these comments; their "loss" is likely psychological rather than realized if adjusted for the split.
The Smart Money: Experienced traders are viewing the 0.28 - 0.29 zone as an accumulation phase, expecting the stock to eventually re-test the equivalent of its old highs (which would be ~0.40 - 0.50 in current terms over the long run).
5. Trading Plan & Advice
For Short-Term Traders: Look for entries as close to 0.285 as possible. Take profit partially at 0.305 and leave the rest for a potential breakout. Watch volume closely at 0.30; if it breaks with high volume, the rally could extend quickly.
For Investors: The stock is financially stable with recent capital increases. Hold your position if you already own it. If the price dips to 0.275, it is a strong "Buy" opportunity.
Note: AI generated based on my thoughtful prompt.

Disclaimer
The information and publications are not meant to be, and do not constitute, financial, investment, trading, or other types of advice or recommendations supplied or endorsed by TradingView. Read more in the Terms of Use.
Disclaimer
The information and publications are not meant to be, and do not constitute, financial, investment, trading, or other types of advice or recommendations supplied or endorsed by TradingView. Read more in the Terms of Use.