
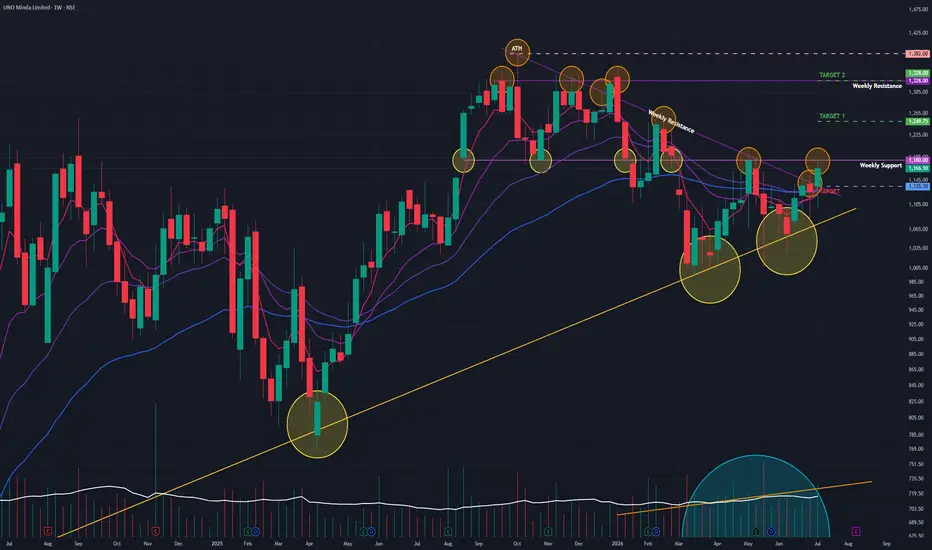
Timeframe: Weekly | Scale: Logarithmic
Uno Minda has successfully broken a multi-month angular downtrend line active since its All-Time High. The stock is now coiled right below a critical horizontal resistance, building momentum for the next leg up.
📈 1. The Chart Structure (The Breakout)
> The Angular Breakout: The stock definitively cleared the descending trendline that had been capping its upside since the ₹1,382 peak. Closing the week near ₹1,163–₹1,166 confirms that buyers have overpowered the bears on this axis.
> The Immediate Ceiling: The stock is currently fighting a "support-turned-resistance" horizontal level. It hit an intraday high of ₹1,179.90 on Friday before facing mild intraday profit-booking.
📊 2. Volume & Indicators
> Volume Ignition: The weekly volume of 6.09 Million is excellent. Consistent volume expansion during a breakout is the most reliable indicator of a sustainable move, showing that the "Smart Money" is participating.
> Trend Harmony:
- EMAs: The Positive Crossover (PCO) of short-term EMAs on both Daily and Weekly charts confirms that the immediate path of least resistance is up.
- Momentum: Both RSI and MACD are rising on both Weekly and Daily timeframes, indicating that bullish momentum is steadily accelerating without being overbought yet.
🎯 3. Future Scenarios & Key Levels
The trade hinges on clearing the immediate horizontal resistance.
🐂 Bullish Targets (The Markup):
Trigger: A decisive Daily/Weekly Close above ₹1,180.
- Target 1: ₹1,250.
- Target 2: ₹1,328.
🛡️ Support (The "Must Hold"):
- Immediate Support: ₹1,135. This is the critical floor. It served as a solid intraday base earlier in the week.
- Invalidation: A close below ₹1,100 would invalidate the breakout momentum and suggest a return to sideways consolidation.
Uno Minda has successfully broken a multi-month angular downtrend line active since its All-Time High. The stock is now coiled right below a critical horizontal resistance, building momentum for the next leg up.
📈 1. The Chart Structure (The Breakout)
> The Angular Breakout: The stock definitively cleared the descending trendline that had been capping its upside since the ₹1,382 peak. Closing the week near ₹1,163–₹1,166 confirms that buyers have overpowered the bears on this axis.
> The Immediate Ceiling: The stock is currently fighting a "support-turned-resistance" horizontal level. It hit an intraday high of ₹1,179.90 on Friday before facing mild intraday profit-booking.
📊 2. Volume & Indicators
> Volume Ignition: The weekly volume of 6.09 Million is excellent. Consistent volume expansion during a breakout is the most reliable indicator of a sustainable move, showing that the "Smart Money" is participating.
> Trend Harmony:
- EMAs: The Positive Crossover (PCO) of short-term EMAs on both Daily and Weekly charts confirms that the immediate path of least resistance is up.
- Momentum: Both RSI and MACD are rising on both Weekly and Daily timeframes, indicating that bullish momentum is steadily accelerating without being overbought yet.
🎯 3. Future Scenarios & Key Levels
The trade hinges on clearing the immediate horizontal resistance.
🐂 Bullish Targets (The Markup):
Trigger: A decisive Daily/Weekly Close above ₹1,180.
- Target 1: ₹1,250.
- Target 2: ₹1,328.
🛡️ Support (The "Must Hold"):
- Immediate Support: ₹1,135. This is the critical floor. It served as a solid intraday base earlier in the week.
- Invalidation: A close below ₹1,100 would invalidate the breakout momentum and suggest a return to sideways consolidation.

Disclaimer
The information and publications are not meant to be, and do not constitute, financial, investment, trading, or other types of advice or recommendations supplied or endorsed by TradingView. Read more in the Terms of Use.
Disclaimer
The information and publications are not meant to be, and do not constitute, financial, investment, trading, or other types of advice or recommendations supplied or endorsed by TradingView. Read more in the Terms of Use.