
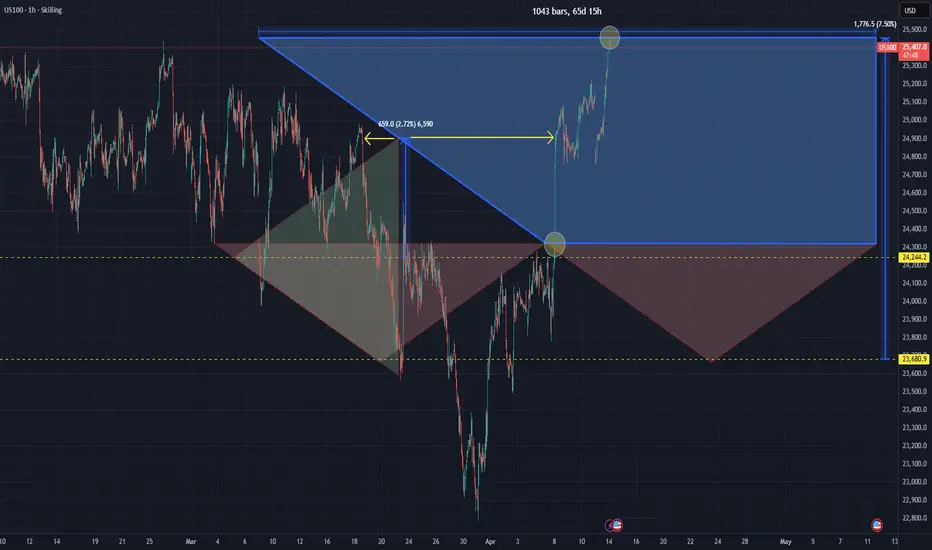
Phase: 1
Date & Time: 2026-03-09 13:50 -5 GMT
Primary Entry M: 24,244.2 $
Secondary Entry P(c): 23,680.9$
Mean Entry: (24,244.2+23,680.9)/2=23,962.55$
Trapezoid Time Duration: 61 Days
3th Triangle domain (%): 2 * 2.72 % = 5.44%
Risk coefficient (R): 1
Risk domain (%) (D): (3th Triangle domain) *(Risk coefficient) = 5.44%*1 = 5.77 %
Hypothetical Capital: 100,000$
Contract Size: 10 Unit
Expected Max Drawdown (%): 5%
Expected Max Drawdown $ (EMDD): 100,000 * 5% = 5,000
Expected Low Price: (1 – 5.44%) * 23,962.55$ = 22,658.99$
Size: 5,000 / (23,962.55 – 22,658.99) ~= 3.84 Unit
Position Size: Size/Contract Size = 3.84 /10 = 0.38
Each Trade Size = 0.38 /2 = 0.19
Targets:
T1 (Mirror / Lower Trapezoid): 24,317$
T2 (Apex N): 24,901 $
T3 (Trapezoid Top): 25,457$
Expected Profit by first entry and Exit at T3 for Scenario No 1:
(T3 - Entry M) * Contract Size * Each Trade Size = (25,457 -24,244.2) *10*0.19= 2,305$
Expected Total Profit for Scenario No 1: 2,305$
Expected Return % for Scenario No 1: 100*(2,305/100,000) = 2.3%
Expected Annual Return% for Scenario No 1: (2.3%*365/61) =13.76%
Expected Profit by 2th entry and Exit at T2 for Scenario No 2:
(T3 - Entry M) * Contract Size * Each Trade Size = (25,457 -24,244.2) *10*0.19= 2,305$
(T2 - Entry P(c)) * Contract Size * Each Trade Size = (24,901 -23,680.9) *10*0.19= 2,318$
Expected Total Profit for Scenario No 2: 2,305+2,318=4,623$
Expected Return% for Scenario No 2: 100*(4,623/100,000) =4.62%
Expected Annual Return% for Scenario No 2: 4.62%*365/61=27.64%
Notes: P(c) may or may not be reached; both M and P(c) are Phase 1 only.
"Both trade sizes are calculated using the hypothetical capital, the investor’s maximum allowed drawdown, the 3rd Triangle Domain percentage, the Risk Coefficient, and the Contract Size."
TotalSize=(EMDD=5000)/(2*D*R*MeanPrice*ContractSize)
Will the next phase be Phase 2 or 3? We are navigating the market to see what happens next.
Phase:3
Date & Time: 2026-03-09 16:00 -5 GMT
Before the price touches the trapezoid on delayed mirror, climbed to the N price level, reaching 24,901$.
Up to this point, the initial position was opened at 24,244.2$ on M level and the Phase3 is completed by reaching the Price at 24,901$. So the price has not retraced down to the P(c) level. Will the next phase be Phase 2? We are navigating the market to see what happens next.
Phase: 2
Date & Time: 2026-04-07 19:30 EST
The Price touched the Trapezoid Lower Boundary at 24,317$, and this event happed after phase3 and during the Trapezoid Time Boundary.
Up to this point, the price has retraced down 22,782$ and the initial position was opened at 24,244.2$ and 23,680.9$ on M and P(c) level is opened. So the Phase 2 is completed by reaching the Price at 24,317$. Will the next phase be Phase 4? We are navigating the market to see what happens next.
Phase: 4
Current Date & Time: 2026-04-13 19:10 EST
First, the Price grew to the N Price Level and half of M position could be released as Safe Exit. then the price dropped from N to 22,782 USD, which triggered the opening of the second position at P(c) at a price of 23,680.9 USD, thereby activating Scenario No. 2. Then, the price moved directly upward to the N price level at 24,901$ after breaking the Trapezoid Lower Boundary, and the second position was closed simultaneously. After the N Level, the price grew to the Trapezoid Upper Boundary at 25,457 USD, and Phase 4 is Completed.
The Price Moves to target 3 as like as expected Scenario 2 in Phase 1.
The expected total profit for Scenario No. 2 in Phase 1 was $4,623 and has now been realized completely twice time at N level and realized 656$ for first time as the Safety-Buffer and 1,783$ for second time, and 2,839$ on Phase 4. So the total realized profit 5,278.
Realized Return (%): 100*(5,278/100,000) = 5.27%
The lowest Price in this path was 22,782$ and the Maximum drawdown calculate as:
(22,782$-23,962.55$) *10*0.38 +656 = -4,486 +656=3,830$
Max Drawdown (%): 100*(-3,830/100,000) =-3.83%
Trapezoid Time Duration: 61 Days
Realized Time Duration: 36 Days
After reaching the N price level and interacting with the Trapezoid Lower Boundary—thereby completing Phases 3 and 2—the price increased up to the upper boundary of the trapezoid.
Date & Time: 2026-03-09 13:50 -5 GMT
Primary Entry M: 24,244.2 $
Secondary Entry P(c): 23,680.9$
Mean Entry: (24,244.2+23,680.9)/2=23,962.55$
Trapezoid Time Duration: 61 Days
3th Triangle domain (%): 2 * 2.72 % = 5.44%
Risk coefficient (R): 1
Risk domain (%) (D): (3th Triangle domain) *(Risk coefficient) = 5.44%*1 = 5.77 %
Hypothetical Capital: 100,000$
Contract Size: 10 Unit
Expected Max Drawdown (%): 5%
Expected Max Drawdown $ (EMDD): 100,000 * 5% = 5,000
Expected Low Price: (1 – 5.44%) * 23,962.55$ = 22,658.99$
Size: 5,000 / (23,962.55 – 22,658.99) ~= 3.84 Unit
Position Size: Size/Contract Size = 3.84 /10 = 0.38
Each Trade Size = 0.38 /2 = 0.19
Targets:
T1 (Mirror / Lower Trapezoid): 24,317$
T2 (Apex N): 24,901 $
T3 (Trapezoid Top): 25,457$
Expected Profit by first entry and Exit at T3 for Scenario No 1:
(T3 - Entry M) * Contract Size * Each Trade Size = (25,457 -24,244.2) *10*0.19= 2,305$
Expected Total Profit for Scenario No 1: 2,305$
Expected Return % for Scenario No 1: 100*(2,305/100,000) = 2.3%
Expected Annual Return% for Scenario No 1: (2.3%*365/61) =13.76%
Expected Profit by 2th entry and Exit at T2 for Scenario No 2:
(T3 - Entry M) * Contract Size * Each Trade Size = (25,457 -24,244.2) *10*0.19= 2,305$
(T2 - Entry P(c)) * Contract Size * Each Trade Size = (24,901 -23,680.9) *10*0.19= 2,318$
Expected Total Profit for Scenario No 2: 2,305+2,318=4,623$
Expected Return% for Scenario No 2: 100*(4,623/100,000) =4.62%
Expected Annual Return% for Scenario No 2: 4.62%*365/61=27.64%
Notes: P(c) may or may not be reached; both M and P(c) are Phase 1 only.
"Both trade sizes are calculated using the hypothetical capital, the investor’s maximum allowed drawdown, the 3rd Triangle Domain percentage, the Risk Coefficient, and the Contract Size."
TotalSize=(EMDD=5000)/(2*D*R*MeanPrice*ContractSize)
Will the next phase be Phase 2 or 3? We are navigating the market to see what happens next.
Phase:3
Date & Time: 2026-03-09 16:00 -5 GMT
Before the price touches the trapezoid on delayed mirror, climbed to the N price level, reaching 24,901$.
Up to this point, the initial position was opened at 24,244.2$ on M level and the Phase3 is completed by reaching the Price at 24,901$. So the price has not retraced down to the P(c) level. Will the next phase be Phase 2? We are navigating the market to see what happens next.
Phase: 2
Date & Time: 2026-04-07 19:30 EST
The Price touched the Trapezoid Lower Boundary at 24,317$, and this event happed after phase3 and during the Trapezoid Time Boundary.
Up to this point, the price has retraced down 22,782$ and the initial position was opened at 24,244.2$ and 23,680.9$ on M and P(c) level is opened. So the Phase 2 is completed by reaching the Price at 24,317$. Will the next phase be Phase 4? We are navigating the market to see what happens next.
Phase: 4
Current Date & Time: 2026-04-13 19:10 EST
First, the Price grew to the N Price Level and half of M position could be released as Safe Exit. then the price dropped from N to 22,782 USD, which triggered the opening of the second position at P(c) at a price of 23,680.9 USD, thereby activating Scenario No. 2. Then, the price moved directly upward to the N price level at 24,901$ after breaking the Trapezoid Lower Boundary, and the second position was closed simultaneously. After the N Level, the price grew to the Trapezoid Upper Boundary at 25,457 USD, and Phase 4 is Completed.
The Price Moves to target 3 as like as expected Scenario 2 in Phase 1.
The expected total profit for Scenario No. 2 in Phase 1 was $4,623 and has now been realized completely twice time at N level and realized 656$ for first time as the Safety-Buffer and 1,783$ for second time, and 2,839$ on Phase 4. So the total realized profit 5,278.
Realized Return (%): 100*(5,278/100,000) = 5.27%
The lowest Price in this path was 22,782$ and the Maximum drawdown calculate as:
(22,782$-23,962.55$) *10*0.38 +656 = -4,486 +656=3,830$
Max Drawdown (%): 100*(-3,830/100,000) =-3.83%
Trapezoid Time Duration: 61 Days
Realized Time Duration: 36 Days
After reaching the N price level and interacting with the Trapezoid Lower Boundary—thereby completing Phases 3 and 2—the price increased up to the upper boundary of the trapezoid.

Related publications
Disclaimer
The information and publications are not meant to be, and do not constitute, financial, investment, trading, or other types of advice or recommendations supplied or endorsed by TradingView. Read more in the Terms of Use.
Related publications
Disclaimer
The information and publications are not meant to be, and do not constitute, financial, investment, trading, or other types of advice or recommendations supplied or endorsed by TradingView. Read more in the Terms of Use.