
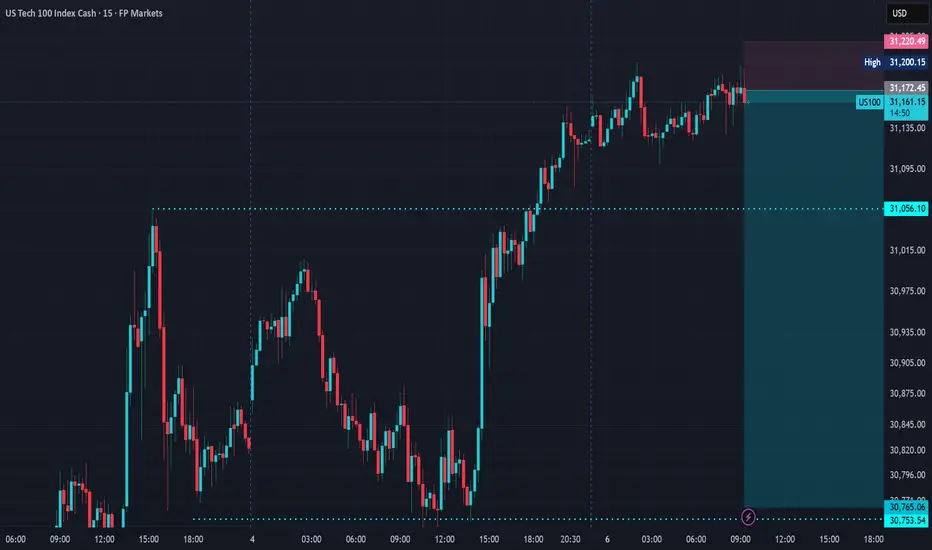
AI tell me : You are shorting US100 / Nasdaq right at a fresh All Time High around 31088-31089. On your M15 you can see it, but on H4 / W1 / MN1 it's even clearer - price is in price discovery. There is no resistance above.
What I see on your screenshot:
1. Trend is still strongly up
From Oct 1st bottom to Oct 6th, it's almost a straight impulse. You have Higher Highs, Higher Lows on M15, M5 LB TARGET broken, and your TDI at the bottom says "Weak Up Trend / Weak Long" - that's still a long bias, not a reversal signal. The yellow boxes you marked are expansion/breakout candles, not exhaustion yet.
2. Selling ATH has no edge by itself
An ATH by itself is not a sell signal. In strong trends, ATH breaks often lead to more ATH breaks because:
No bag-holders above to sell
Shorts are forced to cover
FOMO longs pile in
Your label "Pump Dump High" at the top is telling - market can stay in that pump phase longer than a counter-trend account can survive.
What I see on your screenshot:
1. Trend is still strongly up
From Oct 1st bottom to Oct 6th, it's almost a straight impulse. You have Higher Highs, Higher Lows on M15, M5 LB TARGET broken, and your TDI at the bottom says "Weak Up Trend / Weak Long" - that's still a long bias, not a reversal signal. The yellow boxes you marked are expansion/breakout candles, not exhaustion yet.
2. Selling ATH has no edge by itself
An ATH by itself is not a sell signal. In strong trends, ATH breaks often lead to more ATH breaks because:
No bag-holders above to sell
Shorts are forced to cover
FOMO longs pile in
Your label "Pump Dump High" at the top is telling - market can stay in that pump phase longer than a counter-trend account can survive.
Trade closed: stop reached

Disclaimer
The information and publications are not meant to be, and do not constitute, financial, investment, trading, or other types of advice or recommendations supplied or endorsed by TradingView. Read more in the Terms of Use.
Disclaimer
The information and publications are not meant to be, and do not constitute, financial, investment, trading, or other types of advice or recommendations supplied or endorsed by TradingView. Read more in the Terms of Use.