
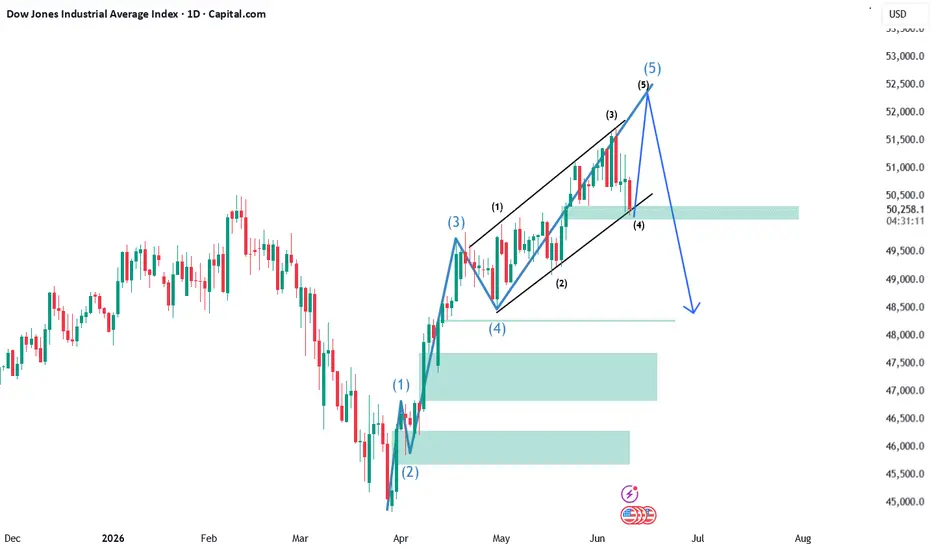
Dow Jones Industrial Average (DJIA) – Elliott Wave Analysis
The chart illustrates a bullish Elliott Wave structure that appears to be nearing completion within a larger impulsive advance. Following the sharp March 2026 decline that bottomed near the 45,000 region, the Dow Jones has staged a strong five-wave recovery.
Current Wave Structure
Wave (1) initiated the reversal from the March lows, signaling the end of the prior bearish phase.
Wave (2) completed as a corrective retracement, holding above the major low and confirming the new uptrend.
Wave (3) unfolded as the strongest and most extended rally, driving prices sharply higher toward the 49,500 zone.
Wave (4) formed a healthy correction, retracing a portion of Wave (3) while respecting key support near 48,500.
The market is currently progressing through Wave (5), which is developing inside an ascending channel and appears to be approaching its terminal phase.
Rising Channel Formation
The black parallel trendlines highlight a well-defined bullish channel containing the advance from Wave (1) onward. Price continues to respect both the upper and lower boundaries of this structure, indicating that buyers remain in control. However, the index is now approaching the upper channel resistance, where momentum exhaustion often occurs.
Key Resistance Zone
The projected Wave (5) target lies between 52,000 and 52,700, where:
The upper channel boundary converges.
The larger degree blue Wave (5) target is located.
Profit-taking pressure is likely to increase.
This region represents a potential completion area for the entire five-wave advance from the March lows.
Bearish Reversal Scenario
Once Wave (5) is completed, the chart suggests a significant corrective decline could begin. The projected blue path indicates:
Initial weakness below 50,500 support.
Breakdown of the ascending channel.
Acceleration toward the 48,500 area.
Potential continuation into deeper corrective territory.
Such a move would likely represent an ABC corrective phase following the completion of the impulsive five-wave structure.
Important Support Levels
50,200 – 50,300: Immediate support and highlighted demand zone.
48,500: Previous Wave (4) support and major structural level.
47,000 – 47,500: Strong demand zone from earlier accumulation.
46,000 – 46,300: Secondary support area if selling intensifies.
Outlook
The broader trend remains bullish while the index stays within the rising channel. However, the current structure suggests the Dow Jones is likely in the final stages of Wave (5), with upside potentially limited to the 52,500 region before a larger corrective decline unfolds. Traders should monitor the completion of the fifth wave and any breakdown below channel support as an early signal that a meaningful correction is underway.
The chart illustrates a bullish Elliott Wave structure that appears to be nearing completion within a larger impulsive advance. Following the sharp March 2026 decline that bottomed near the 45,000 region, the Dow Jones has staged a strong five-wave recovery.
Current Wave Structure
Wave (1) initiated the reversal from the March lows, signaling the end of the prior bearish phase.
Wave (2) completed as a corrective retracement, holding above the major low and confirming the new uptrend.
Wave (3) unfolded as the strongest and most extended rally, driving prices sharply higher toward the 49,500 zone.
Wave (4) formed a healthy correction, retracing a portion of Wave (3) while respecting key support near 48,500.
The market is currently progressing through Wave (5), which is developing inside an ascending channel and appears to be approaching its terminal phase.
Rising Channel Formation
The black parallel trendlines highlight a well-defined bullish channel containing the advance from Wave (1) onward. Price continues to respect both the upper and lower boundaries of this structure, indicating that buyers remain in control. However, the index is now approaching the upper channel resistance, where momentum exhaustion often occurs.
Key Resistance Zone
The projected Wave (5) target lies between 52,000 and 52,700, where:
The upper channel boundary converges.
The larger degree blue Wave (5) target is located.
Profit-taking pressure is likely to increase.
This region represents a potential completion area for the entire five-wave advance from the March lows.
Bearish Reversal Scenario
Once Wave (5) is completed, the chart suggests a significant corrective decline could begin. The projected blue path indicates:
Initial weakness below 50,500 support.
Breakdown of the ascending channel.
Acceleration toward the 48,500 area.
Potential continuation into deeper corrective territory.
Such a move would likely represent an ABC corrective phase following the completion of the impulsive five-wave structure.
Important Support Levels
50,200 – 50,300: Immediate support and highlighted demand zone.
48,500: Previous Wave (4) support and major structural level.
47,000 – 47,500: Strong demand zone from earlier accumulation.
46,000 – 46,300: Secondary support area if selling intensifies.
Outlook
The broader trend remains bullish while the index stays within the rising channel. However, the current structure suggests the Dow Jones is likely in the final stages of Wave (5), with upside potentially limited to the 52,500 region before a larger corrective decline unfolds. Traders should monitor the completion of the fifth wave and any breakdown below channel support as an early signal that a meaningful correction is underway.
Trade closed: target reached

Disclaimer
The information and publications are not meant to be, and do not constitute, financial, investment, trading, or other types of advice or recommendations supplied or endorsed by TradingView. Read more in the Terms of Use.
Disclaimer
The information and publications are not meant to be, and do not constitute, financial, investment, trading, or other types of advice or recommendations supplied or endorsed by TradingView. Read more in the Terms of Use.