
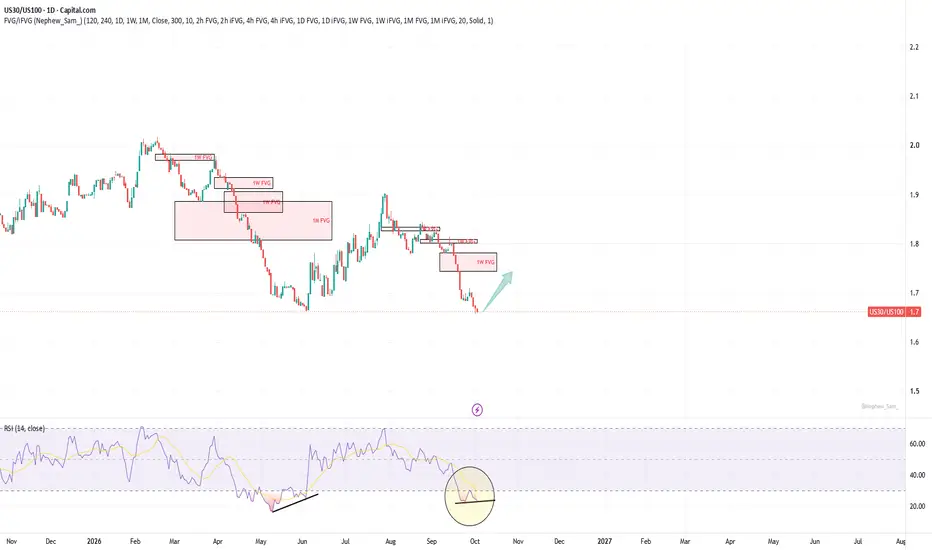
The daily positive divergence is not just on DJI and US30 charts but also on US30/US100 and DJI/NDX charts. This means if it will be confirmed Dow Jones may outperform nasdaq for some time.
Note
There is also a developing weekly divergence on US30 divided by US100 chart. When Nasdaq underperforms Dow Jones indices usually decline. We might see a deep correction on all indices soon.Order cancelled
Daily divergence was invalidated today. Need to wait for a new one.Note
Well, it worked anyway. Looks like RSI length = 7 works better for this chart.
Disclaimer
The information and publications are not meant to be, and do not constitute, financial, investment, trading, or other types of advice or recommendations supplied or endorsed by TradingView. Read more in the Terms of Use.
Disclaimer
The information and publications are not meant to be, and do not constitute, financial, investment, trading, or other types of advice or recommendations supplied or endorsed by TradingView. Read more in the Terms of Use.