
📈 US500 Long Setup – Inverse H&S + Key Support
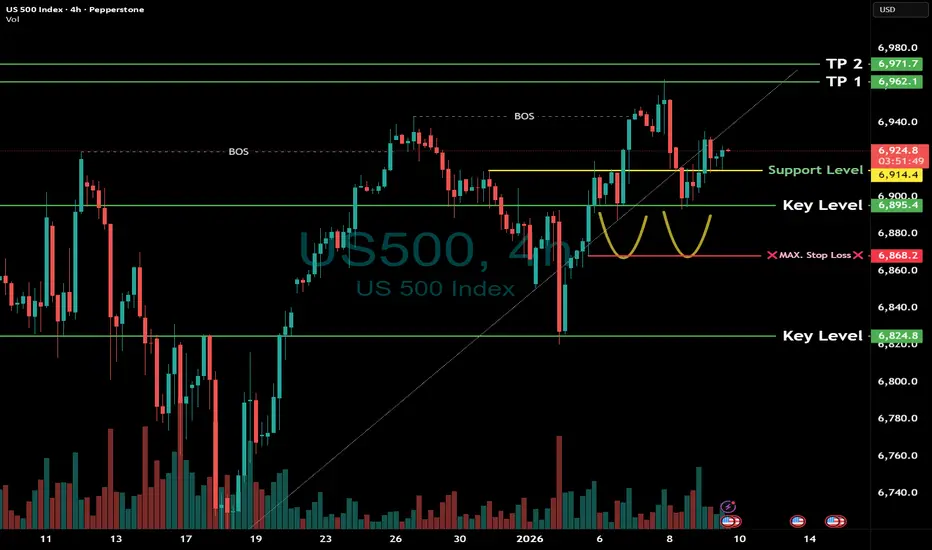
The US500 4H chart is shaping up for a bullish continuation, with multiple technical signals aligning. Price has recently formed a potential inverse head and shoulders pattern, suggesting a reversal from the recent downtrend. With Break of Structure (BOS) confirmed and price holding above the Support Level at 6914.4, bulls are gaining control.
🟢 Trade Setup Details
- Support Level: 6914.4
- Key Levels to Watch: 6895.4 and 6824.8
- Maximum Stop Loss: 6868.2
- Take Profit Targets:
- 🎯 TP1: 6962.1
- 🎯 TP2: 6971.7
The current price action around 6925.9 shows strength, with volume supporting the bullish breakout.
🔍 Technical Highlights
- Two Break of Structure (BOS) points confirm bullish momentum.
- The inverse head and shoulders pattern adds confluence to the long bias.
- Price is holding above key support and reclaiming higher ground.
- Volume shows increasing interest on bullish candles, suggesting accumulation.
📈 Bullish Scenario
If price continues to hold above 6914.4, we could see a push toward TP1 and TP2. Watch for:
- Retest of neckline with bullish confirmation
- Momentum indicators crossing into bullish territory
- Volume spike on breakout above 6930–6940
⚠️ Risk Management
- SL below 6868.2 protects against invalidation of the inverse H&S pattern.
- Consider scaling out at TP1 and TP2 to lock in gains.
- Avoid chasing if price moves too far—wait for pullbacks or confirmation candles.
💡 Summary: US500 is showing a textbook bullish reversal setup, with inverse head and shoulders, Break of Structure, and strong support at 6914.4. With layered TP targets and a tight SL, this trade offers a clean structure and solid risk/reward.
🚀 Whether you're trading the breakout or riding the momentum toward 6970+, this setup deserves your attention.
The US500 4H chart is shaping up for a bullish continuation, with multiple technical signals aligning. Price has recently formed a potential inverse head and shoulders pattern, suggesting a reversal from the recent downtrend. With Break of Structure (BOS) confirmed and price holding above the Support Level at 6914.4, bulls are gaining control.
🟢 Trade Setup Details
- Support Level: 6914.4
- Key Levels to Watch: 6895.4 and 6824.8
- Maximum Stop Loss: 6868.2
- Take Profit Targets:
- 🎯 TP1: 6962.1
- 🎯 TP2: 6971.7
The current price action around 6925.9 shows strength, with volume supporting the bullish breakout.
🔍 Technical Highlights
- Two Break of Structure (BOS) points confirm bullish momentum.
- The inverse head and shoulders pattern adds confluence to the long bias.
- Price is holding above key support and reclaiming higher ground.
- Volume shows increasing interest on bullish candles, suggesting accumulation.
📈 Bullish Scenario
If price continues to hold above 6914.4, we could see a push toward TP1 and TP2. Watch for:
- Retest of neckline with bullish confirmation
- Momentum indicators crossing into bullish territory
- Volume spike on breakout above 6930–6940
⚠️ Risk Management
- SL below 6868.2 protects against invalidation of the inverse H&S pattern.
- Consider scaling out at TP1 and TP2 to lock in gains.
- Avoid chasing if price moves too far—wait for pullbacks or confirmation candles.
💡 Summary: US500 is showing a textbook bullish reversal setup, with inverse head and shoulders, Break of Structure, and strong support at 6914.4. With layered TP targets and a tight SL, this trade offers a clean structure and solid risk/reward.
🚀 Whether you're trading the breakout or riding the momentum toward 6970+, this setup deserves your attention.

🔥my free signals and AI trading indicators channel telegram
t.me/strengthboosters
~1 Forex setup per day. With ICT setup for intraday trading —— Accuracy +80%
-Booster highlight:
US stocks and Crypto watch list update each weekend.
t.me/strengthboosters
~1 Forex setup per day. With ICT setup for intraday trading —— Accuracy +80%
-Booster highlight:
US stocks and Crypto watch list update each weekend.
Disclaimer
The information and publications are not meant to be, and do not constitute, financial, investment, trading, or other types of advice or recommendations supplied or endorsed by TradingView. Read more in the Terms of Use.
🔥my free signals and AI trading indicators channel telegram
t.me/strengthboosters
~1 Forex setup per day. With ICT setup for intraday trading —— Accuracy +80%
-Booster highlight:
US stocks and Crypto watch list update each weekend.
t.me/strengthboosters
~1 Forex setup per day. With ICT setup for intraday trading —— Accuracy +80%
-Booster highlight:
US stocks and Crypto watch list update each weekend.
Disclaimer
The information and publications are not meant to be, and do not constitute, financial, investment, trading, or other types of advice or recommendations supplied or endorsed by TradingView. Read more in the Terms of Use.