

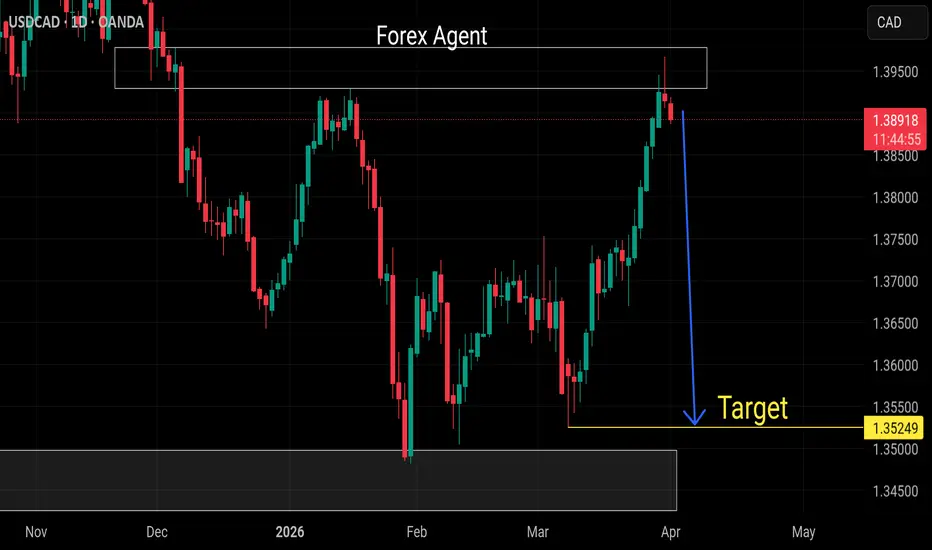
This USD/CAD daily chart highlights a decisive moment where the price has reached a multi-month resistance zone, often referred to as a "supply wall."
* Resistance Rejection: The price recently spiked into the 1.3900+ zone but immediately faced selling pressure, forming a bearish rejection wick.
* The Bearish Target: A clear downward projection is set toward 1.35249, which aligns with the significant swing lows established back in early March.
* Trend Shift: After a strong bullish rally throughout March, the current price action suggests momentum is stalling as it fails to break through the historical ceiling.
* Market Structure: The chart depicts a potential range-play strategy, where traders look to "sell the top" of the range in anticipation of a move back to the established floor.
* Risk Level: The setup remains valid as long as the resistance box holds; a daily close above 1.3950 would likely cancel this bearish "Target" outlook.
* Resistance Rejection: The price recently spiked into the 1.3900+ zone but immediately faced selling pressure, forming a bearish rejection wick.
* The Bearish Target: A clear downward projection is set toward 1.35249, which aligns with the significant swing lows established back in early March.
* Trend Shift: After a strong bullish rally throughout March, the current price action suggests momentum is stalling as it fails to break through the historical ceiling.
* Market Structure: The chart depicts a potential range-play strategy, where traders look to "sell the top" of the range in anticipation of a move back to the established floor.
* Risk Level: The setup remains valid as long as the resistance box holds; a daily close above 1.3950 would likely cancel this bearish "Target" outlook.

Disclaimer
The information and publications are not meant to be, and do not constitute, financial, investment, trading, or other types of advice or recommendations supplied or endorsed by TradingView. Read more in the Terms of Use.
Disclaimer
The information and publications are not meant to be, and do not constitute, financial, investment, trading, or other types of advice or recommendations supplied or endorsed by TradingView. Read more in the Terms of Use.