

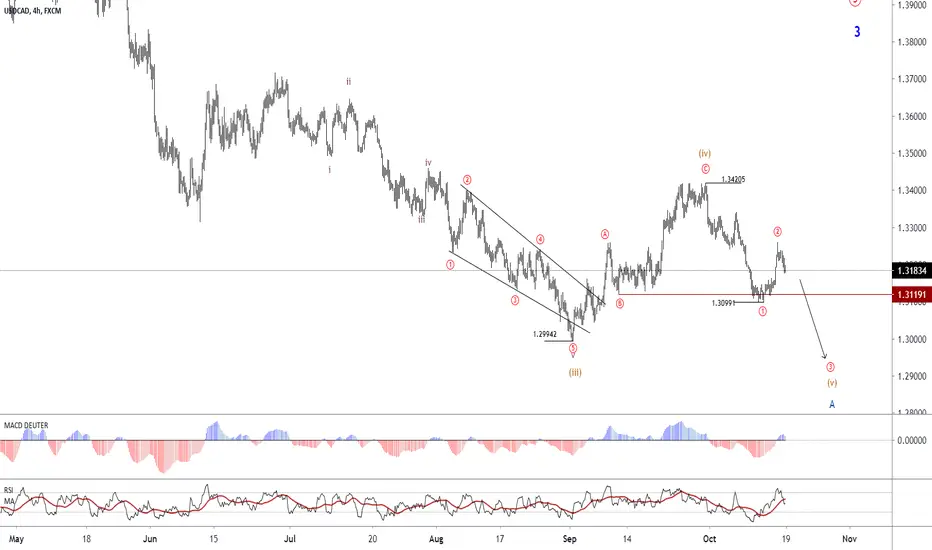
By the price crossing the 1.3099 range, the uptrend encountered some changes, which can be seen in the daily chart.
The overall structure is in the form of a Double Zigzag pattern (in the daily chart) and in the 240-minute chart, the price is completing the V wave from the point of A, which can be extended up to the targets of 1.2950. And in continuation, we enter the corrective (uptrend) to accomplish wave B.
The overall structure is in the form of a Double Zigzag pattern (in the daily chart) and in the 240-minute chart, the price is completing the V wave from the point of A, which can be extended up to the targets of 1.2950. And in continuation, we enter the corrective (uptrend) to accomplish wave B.

Disclaimer
The information and publications are not meant to be, and do not constitute, financial, investment, trading, or other types of advice or recommendations supplied or endorsed by TradingView. Read more in the Terms of Use.
Disclaimer
The information and publications are not meant to be, and do not constitute, financial, investment, trading, or other types of advice or recommendations supplied or endorsed by TradingView. Read more in the Terms of Use.