

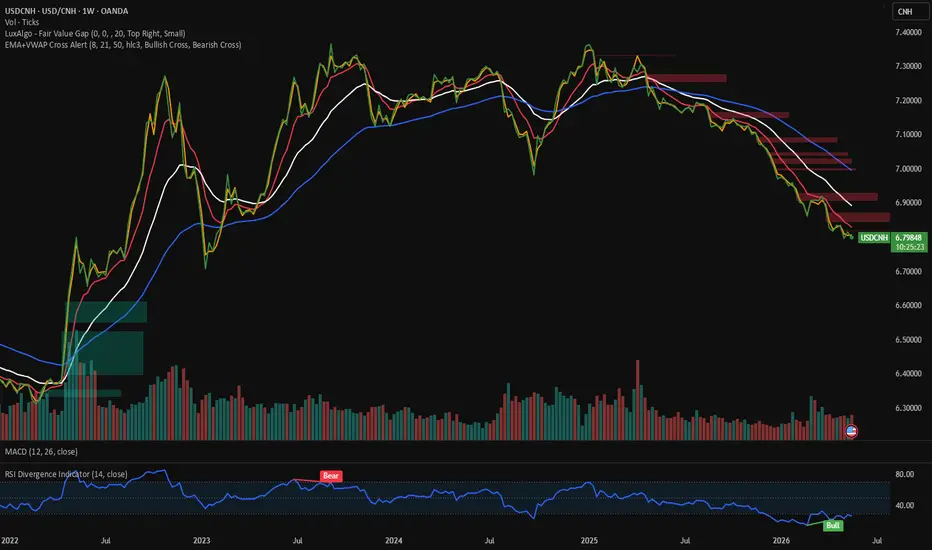
The weekly chart for USDCNH is telling the real macroeconomic story
of 2026, and most of the market is completely missing it.
While the DXY crushes allied currencies (with USDJPY pushing 159), the
Chinese Yuan has been steadily strengthening against the dollar for
nearly three years. We are now sitting below 6.80.
Look at the two key pivot points on this weekly chart:
1. April 2025: Tariff announcements sparked a brief panic spike to
~7.40. The market immediately rejected this, using the tariffs as
cover to accelerate Yuan internationalization.
2. February/March 2026: The downtrend accelerates violently, slicing
through support. This correlates perfectly with the Iran conflict.
This 8% move is an earthquake for a managed float. What we are seeing
is the real-time structural shift of the Petro-Yuan. China secured
exclusive Hormuz access, bypassed the dollar for energy settlement,
and is importing deflation while the West imports inflation.
Notice the RSI repeatedly flipping bullish at the bottom of this
downtrend—momentum is accelerating, not exhausting. The geopolitical
chess pieces are moving, and it is showing up directly in the forex
data.
of 2026, and most of the market is completely missing it.
While the DXY crushes allied currencies (with USDJPY pushing 159), the
Chinese Yuan has been steadily strengthening against the dollar for
nearly three years. We are now sitting below 6.80.
Look at the two key pivot points on this weekly chart:
1. April 2025: Tariff announcements sparked a brief panic spike to
~7.40. The market immediately rejected this, using the tariffs as
cover to accelerate Yuan internationalization.
2. February/March 2026: The downtrend accelerates violently, slicing
through support. This correlates perfectly with the Iran conflict.
This 8% move is an earthquake for a managed float. What we are seeing
is the real-time structural shift of the Petro-Yuan. China secured
exclusive Hormuz access, bypassed the dollar for energy settlement,
and is importing deflation while the West imports inflation.
Notice the RSI repeatedly flipping bullish at the bottom of this
downtrend—momentum is accelerating, not exhausting. The geopolitical
chess pieces are moving, and it is showing up directly in the forex
data.

Disclaimer
The information and publications are not meant to be, and do not constitute, financial, investment, trading, or other types of advice or recommendations supplied or endorsed by TradingView. Read more in the Terms of Use.
Disclaimer
The information and publications are not meant to be, and do not constitute, financial, investment, trading, or other types of advice or recommendations supplied or endorsed by TradingView. Read more in the Terms of Use.