

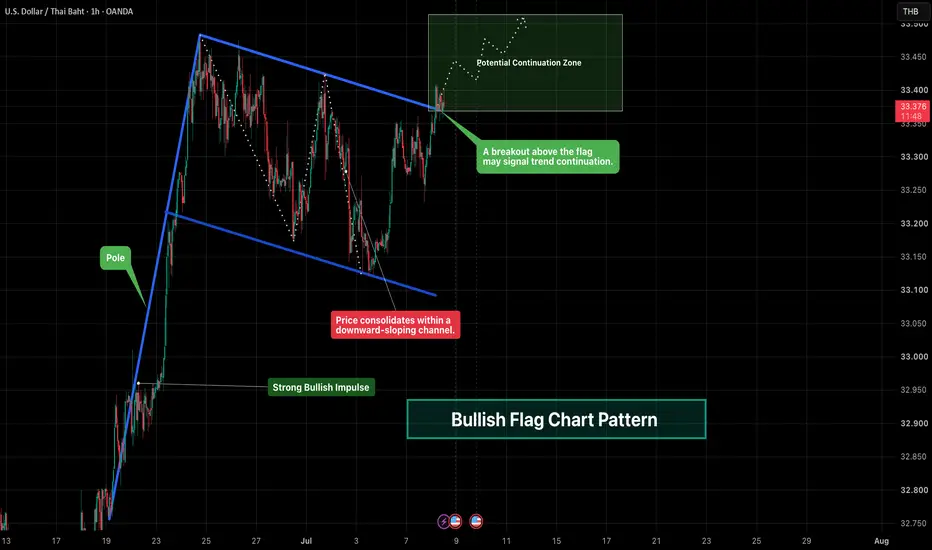
Bullish Flag Chart Pattern
-------------------------------------------------------------
Overview
---------------------------------------------------------------
Definition
--------------------------------------------------------------
Concept
--------------------------------------------------------------
Chart Explanation
--------------------------------------------------------------
Key Observations
--------------------------------------------------------------
Why It Matters
-------------------------------------------------------------
Conclusion
-------------------------------------------------------------
⚠️ Disclaimer
-------------------------------------------------------------
Overview
The Bullish Flag Chart Pattern is a continuation pattern that typically develops after a strong bullish impulse. Following the initial upward move, price enters a temporary consolidation phase within a downward-sloping channel. This pause allows the market to absorb profit-taking before the prevailing trend attempts to resume. A confirmed breakout above the flag may indicate the continuation of the existing bullish trend.
---------------------------------------------------------------
Definition
A Bullish Flag consists of two main components: a strong upward movement known as the flagpole followed by a downward-sloping consolidation known as the flag. The consolidation represents a temporary pause in bullish momentum rather than an immediate trend reversal. The pattern is considered complete only after price confirms a breakout above the upper trendline.
--------------------------------------------------------------
Concept
The Bullish Flag reflects a healthy pause within an established uptrend. During consolidation, buyers and sellers temporarily reach equilibrium while the market digests the previous advance. As selling pressure gradually weakens and buyers regain control, price may attempt to continue in the direction of the prevailing trend.
--------------------------------------------------------------
Chart Explanation
- A strong bullish impulse forms the **flagpole**..
- Price consolidates within a downward-sloping channel.
- The channel represents a temporary pause in the prevailing uptrend.
- The upper trendline acts as dynamic resistance during consolidation.
- The lower trendline provides temporary structural support.
- A confirmed breakout above the flag may signal bullish trend continuation
--------------------------------------------------------------
Key Observations
- Strong buying momentum creates the initial flagpole.
- Price remains confined within a downward-sloping channel.
- The consolidation phase develops after a sharp upward move.
- Buyers gradually regain strength near the upper boundary.
- The broader bullish structure remains valid while the flag is respected.
--------------------------------------------------------------
Why It Matters
Understanding the Bullish Flag helps market participants recognize temporary consolidations within an existing uptrend. Instead of interpreting every pullback as a reversal, this pattern demonstrates how markets often pause before continuing in the direction of the prevailing trend. Waiting for breakout confirmation encourages a disciplined approach to price action analysis.
-------------------------------------------------------------
Conclusion
The Bullish Flag is a classic continuation pattern that combines a strong bullish impulse with a period of orderly consolidation. While the pattern remains intact, the flag boundaries define the current market structure. A confirmed breakout above the upper trendline may indicate the continuation of bullish momentum, whereas failure to maintain the structure may result in extended consolidation.
-------------------------------------------------------------
⚠️ Disclaimer
📘 For educational purposes only..
🙅 Not SEBI registered.
❌ Not a buy/sell recommendation.
🧠 Purely a learning resource.
📊 Not Financial Advice

Pine Script Developer • Market Analysis
Disclaimer
The information and publications are not meant to be, and do not constitute, financial, investment, trading, or other types of advice or recommendations supplied or endorsed by TradingView. Read more in the Terms of Use.
Pine Script Developer • Market Analysis
Disclaimer
The information and publications are not meant to be, and do not constitute, financial, investment, trading, or other types of advice or recommendations supplied or endorsed by TradingView. Read more in the Terms of Use.