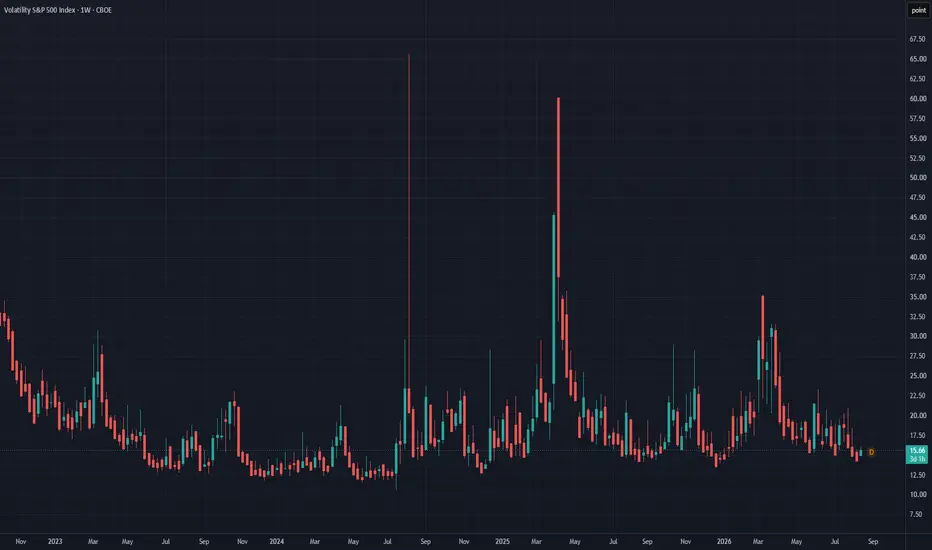
Looking at  VIX this week, the opening print of $14.98 struck me as a little odd. You don't have to stick your head out far to see there's more than a fair share of uncertainty around the globe this summer, and for market-oriented folk I am sure by now you are feeling the heat.
The omnipresent blip on every trader's radar, the conflict in Iran, and tenuous logistics surrounding the strait of Hormuz persists. Yet I can scarcely imagine a professional who is jumping into Crude Oil CL1! crude longs at the rumor, or even the outright news of a flare up by now. The heavy hitters called this one baked in back in April, and the print has read true on this verdict since. We still see elevated prices compared to the better part of the last decade, but crude oil is not the focus of this post.
Let's take a look into some of the fallout from this price shock, and how 'priced in' may have translated into the lowest volatility print since January.

The above chart is a 1 year line chart of volatility indicators for the major market indices, S&P500 vol -VIX (blue), Nasdaq vol -  VXN (red), Dow Jones Industrial Average vol - VVXD (green), and US Bond market vol -
 MOVE (orange). We have laid these out on a percentage change basis, where some interesting trends emerge. We see that the three equity benchmarks are retracing to pre-conflict lows, though Nasdaq vol remains elevated we will get into that later. The benchmark for bond volatility has been trending upwards, spiked with the war but has not retraced below the lows it made in April as the market rebounded. This is important, as options contracts take a bearing of both equity and bond volatility when it comes to pricing. So we may see both VIX and MOVE as independent but correlated underlying parameters of SPX equity options, which is a growing market at this time as investors seek cheap leverage and hedging. Which begs the titular question - are we seeing speculative buying of SPX or upside hedging of the VIX?

Here we have a 5 year bar chart of VIX volatility -VVIX (white) and VIX - VIX (pink), as well as some basic trendlines (green). For those not well versed in options pricing or fractality, implied volatility is a bit of a mathematical perplexity, but as a result we have the volatility of the volatility as a parameter that can be measured. What we clearly see is an uptrend in this measure, meaning VIX hedging is getting more expensive. This is doubly-so, if we consider that MOVE is also a parameter at play, and the uptrend there pushed options premiums higher across the board. Interestingly, where the VVIX held it's uptrend the VIX appears to break down, though neither market is producing higher highs at this time, only the VIX is threatening lower lows.

Now here is an interesting trend, that I wish to make note of, though I caution looking too deeply into. Above is a 5-year bar chart of DJIA vol - VVXD (white), above its Average True Range - ATR (lower window). The distinct pattern of this market appears to have disappeared, the range of its movements becoming suddenly very tight and orderly in late April '26, further indicated by the ATR. What this means, I cannot speculate. But investors should consider that volatility markets are under the bright lights of large institutions at this time.

Above is a messy chart, with the US 10-year benchmark yield - US10Y (white) and a handful of tech companies that have been leading the recent rally. Goldman Sachs Group -
 GS (pink) is also tucked in there. These companies have been expanding rapidly, and putting a lot of debt on the table as a result. Many of us are aware of the credit implications of the 'AI boom' - which I believe under no circumstances at this time is a bubble - let me be clear. Yet as interest rates and inflation rise due to geopolitical instability, the current valuations of these markets even as they back off all-time-highs, should be considered in the light of the VIX making new lows.
Consider the long-term view, and the complexity of potential positioning on Wall Street at this time. The credit instruments involved, and the hedging flows pass through a deep market of complex derivatives, all of which see MOVE on the rise. With VVIX moving in lockstep, I would suggest that VIX is being heavily hedged against the upside, with volume across the tech sector in downtrend and the credit cycle tightening. We could see a pause at this level or further decline in equities.
VIX this week, the opening print of $14.98 struck me as a little odd. You don't have to stick your head out far to see there's more than a fair share of uncertainty around the globe this summer, and for market-oriented folk I am sure by now you are feeling the heat.The omnipresent blip on every trader's radar, the conflict in Iran, and tenuous logistics surrounding the strait of Hormuz persists. Yet I can scarcely imagine a professional who is jumping into Crude Oil
CL1! crude longs at the rumor, or even the outright news of a flare up by now. The heavy hitters called this one baked in back in April, and the print has read true on this verdict since. We still see elevated prices compared to the better part of the last decade, but crude oil is not the focus of this post.Let's take a look into some of the fallout from this price shock, and how 'priced in' may have translated into the lowest volatility print since January.
The above chart is a 1 year line chart of volatility indicators for the major market indices, S&P500 vol -
VIX (blue), Nasdaq vol - VXN (red), Dow Jones Industrial Average vol - VVXD (green), and US Bond market vol - MOVE (orange). We have laid these out on a percentage change basis, where some interesting trends emerge. We see that the three equity benchmarks are retracing to pre-conflict lows, though Nasdaq vol remains elevated we will get into that later. The benchmark for bond volatility has been trending upwards, spiked with the war but has not retraced below the lows it made in April as the market rebounded. This is important, as options contracts take a bearing of both equity and bond volatility when it comes to pricing. So we may see both VIX and MOVE as independent but correlated underlying parameters of SPX equity options, which is a growing market at this time as investors seek cheap leverage and hedging. Which begs the titular question - are we seeing speculative buying of SPX or upside hedging of the VIX? Here we have a 5 year bar chart of VIX volatility -
VVIX (white) and VIX - VIX (pink), as well as some basic trendlines (green). For those not well versed in options pricing or fractality, implied volatility is a bit of a mathematical perplexity, but as a result we have the volatility of the volatility as a parameter that can be measured. What we clearly see is an uptrend in this measure, meaning VIX hedging is getting more expensive. This is doubly-so, if we consider that MOVE is also a parameter at play, and the uptrend there pushed options premiums higher across the board. Interestingly, where the VVIX held it's uptrend the VIX appears to break down, though neither market is producing higher highs at this time, only the VIX is threatening lower lows.Now here is an interesting trend, that I wish to make note of, though I caution looking too deeply into. Above is a 5-year bar chart of DJIA vol - VVXD (white), above its Average True Range - ATR (lower window). The distinct pattern of this market appears to have disappeared, the range of its movements becoming suddenly very tight and orderly in late April '26, further indicated by the ATR. What this means, I cannot speculate. But investors should consider that volatility markets are under the bright lights of large institutions at this time.
Above is a messy chart, with the US 10-year benchmark yield -
US10Y (white) and a handful of tech companies that have been leading the recent rally. Goldman Sachs Group - GS (pink) is also tucked in there. These companies have been expanding rapidly, and putting a lot of debt on the table as a result. Many of us are aware of the credit implications of the 'AI boom' - which I believe under no circumstances at this time is a bubble - let me be clear. Yet as interest rates and inflation rise due to geopolitical instability, the current valuations of these markets even as they back off all-time-highs, should be considered in the light of the VIX making new lows.Consider the long-term view, and the complexity of potential positioning on Wall Street at this time. The credit instruments involved, and the hedging flows pass through a deep market of complex derivatives, all of which see MOVE on the rise. With VVIX moving in lockstep, I would suggest that VIX is being heavily hedged against the upside, with volume across the tech sector in downtrend and the credit cycle tightening. We could see a pause at this level or further decline in equities.

Disclaimer
The information and publications are not meant to be, and do not constitute, financial, investment, trading, or other types of advice or recommendations supplied or endorsed by TradingView. Read more in the Terms of Use.
Disclaimer
The information and publications are not meant to be, and do not constitute, financial, investment, trading, or other types of advice or recommendations supplied or endorsed by TradingView. Read more in the Terms of Use.