
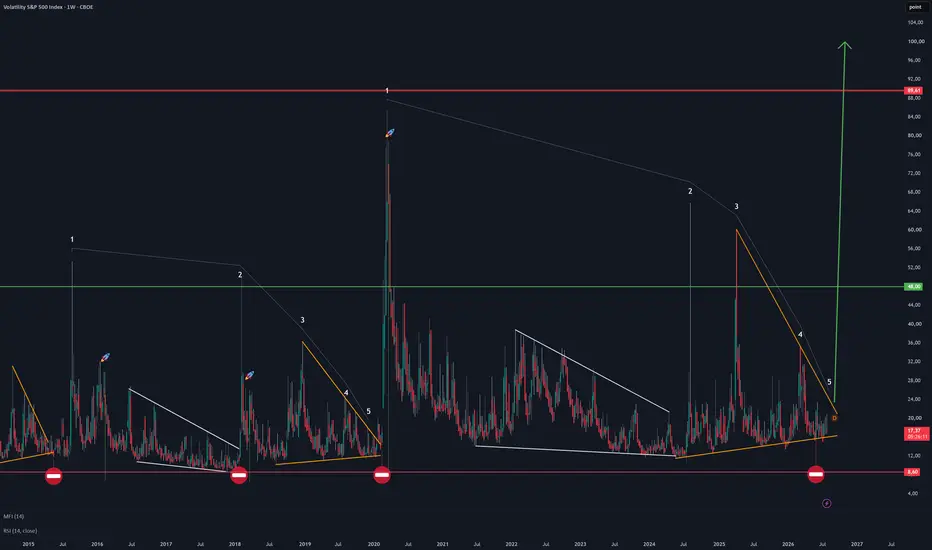
Das Muster von 2015-2020, das in den Corona-Crash mündete wiederholt sich im Volatilitätsindex Vix. Nur ist es diesmal größer. Ob es wirklich so kommt bleibt natürlich abzuwarten.
Auf jedenfall sehr unheimlicher Chart.
SPX/VIX ratio

Dazu ein passender Ausblick wenn es kein neues Hoch gibt
SP500


Nasdaq100

Halbleitercrash?

Junk Bonds vs SP500 Divergenz

Crude Oil vs SP500


Auf jedenfall sehr unheimlicher Chart.
SPX/VIX ratio
Dazu ein passender Ausblick wenn es kein neues Hoch gibt
SP500
Nasdaq100
Halbleitercrash?
Junk Bonds vs SP500 Divergenz
Crude Oil vs SP500
Trade active
Beim Vix wirds immer enger, er ist unten raus aber nun wieder im wedge.junk bonds sehr schwach zum SPX
OIL/SPX
Trade closed: target reached
Hier bahnt sich Ungemach an..Zinskurve marschiert nach oben
Hochzinsanleihen crashen, Credit spreads weiten sich

Related publications
Disclaimer
The information and publications are not meant to be, and do not constitute, financial, investment, trading, or other types of advice or recommendations supplied or endorsed by TradingView. Read more in the Terms of Use.
Related publications
Disclaimer
The information and publications are not meant to be, and do not constitute, financial, investment, trading, or other types of advice or recommendations supplied or endorsed by TradingView. Read more in the Terms of Use.