
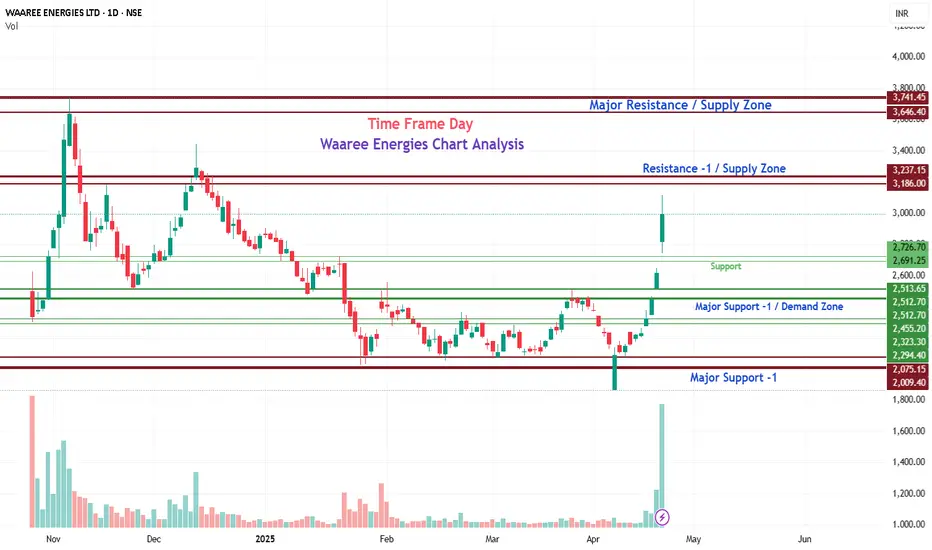
Detailed chart analysis of Waaree Energies Ltd. based on the Daily Time Frame (1D)
Chart as of April 23, 2025
Current Price Movement
- LTP (Last Traded Price): ₹2,983.00
- Change: +₹367.10 (+14.03%) — A strong bullish candle with a significant gap-up.
- Volume: 19.82M — Strong volume confirmation indicating institutional interest.
Resistance / Supply Zones
1. Resistance - 1 (Supply Zone)
₹3,186.00 – ₹3,237.15
This is the nearest resistance zone where the stock may face selling pressure. Previous supply has emerged here, and buyers may take profit.
2. Major Resistance / Supply Zone
₹3,646.40 – ₹3,741.45
This zone marks the previous major highs and is a key resistance area. A breakout above this may indicate a strong continuation of the uptrend.
Support / Demand Zones
1. Major Support - 1 (Demand Zone)
₹2,455.20 – ₹2,512.70
This is the most recent breakout zone. If the price corrects, this area may act as a strong support level.
2. Support Zone - 2
- ₹2,294.40 – ₹2,323.30
- Acts as the next layer of support if ₹2,455 fails to hold.
3. Major Support - 2
- ₹2,009.40 – ₹2,075.15
- Long-term support zone, previously tested multiple times, can act as a strong demand zone in case of major correction.
Price Structure & Volume
- The chart shows a **strong bullish breakout** after forming a **higher low**.
- Today's price action indicates a **gap-up opening with heavy buying interest**.
- Volume confirms the breakout — higher than average volume during the up move suggests strong conviction.
Key Technical Takeaways
- Trend Reversal Confirmation: After a prolonged downtrend, price has shown a strong bullish reversal.
- Bullish Breakout: Price broke through multiple resistances with volume confirmation.
- Watch for Retest: In case of pullback, ₹2,455–₹2,512 zone should be watched for buying interest.
Targets
- First Target: ₹3,186–₹3,237
- Final Resistance Target: ₹3,646–₹3,741
- If the price fails to sustain above ₹2,983 and closes below ₹2,512 in coming sessions, it might signal a false breakout or correction.
Chart as of April 23, 2025
Current Price Movement
- LTP (Last Traded Price): ₹2,983.00
- Change: +₹367.10 (+14.03%) — A strong bullish candle with a significant gap-up.
- Volume: 19.82M — Strong volume confirmation indicating institutional interest.
Resistance / Supply Zones
1. Resistance - 1 (Supply Zone)
₹3,186.00 – ₹3,237.15
This is the nearest resistance zone where the stock may face selling pressure. Previous supply has emerged here, and buyers may take profit.
2. Major Resistance / Supply Zone
₹3,646.40 – ₹3,741.45
This zone marks the previous major highs and is a key resistance area. A breakout above this may indicate a strong continuation of the uptrend.
Support / Demand Zones
1. Major Support - 1 (Demand Zone)
₹2,455.20 – ₹2,512.70
This is the most recent breakout zone. If the price corrects, this area may act as a strong support level.
2. Support Zone - 2
- ₹2,294.40 – ₹2,323.30
- Acts as the next layer of support if ₹2,455 fails to hold.
3. Major Support - 2
- ₹2,009.40 – ₹2,075.15
- Long-term support zone, previously tested multiple times, can act as a strong demand zone in case of major correction.
Price Structure & Volume
- The chart shows a **strong bullish breakout** after forming a **higher low**.
- Today's price action indicates a **gap-up opening with heavy buying interest**.
- Volume confirms the breakout — higher than average volume during the up move suggests strong conviction.
Key Technical Takeaways
- Trend Reversal Confirmation: After a prolonged downtrend, price has shown a strong bullish reversal.
- Bullish Breakout: Price broke through multiple resistances with volume confirmation.
- Watch for Retest: In case of pullback, ₹2,455–₹2,512 zone should be watched for buying interest.
Targets
- First Target: ₹3,186–₹3,237
- Final Resistance Target: ₹3,646–₹3,741
- If the price fails to sustain above ₹2,983 and closes below ₹2,512 in coming sessions, it might signal a false breakout or correction.

Disclaimer
The information and publications are not meant to be, and do not constitute, financial, investment, trading, or other types of advice or recommendations supplied or endorsed by TradingView. Read more in the Terms of Use.
Disclaimer
The information and publications are not meant to be, and do not constitute, financial, investment, trading, or other types of advice or recommendations supplied or endorsed by TradingView. Read more in the Terms of Use.