
## WTI CRUDE OIL (USOIL) – 5-Hour Chart Analysis
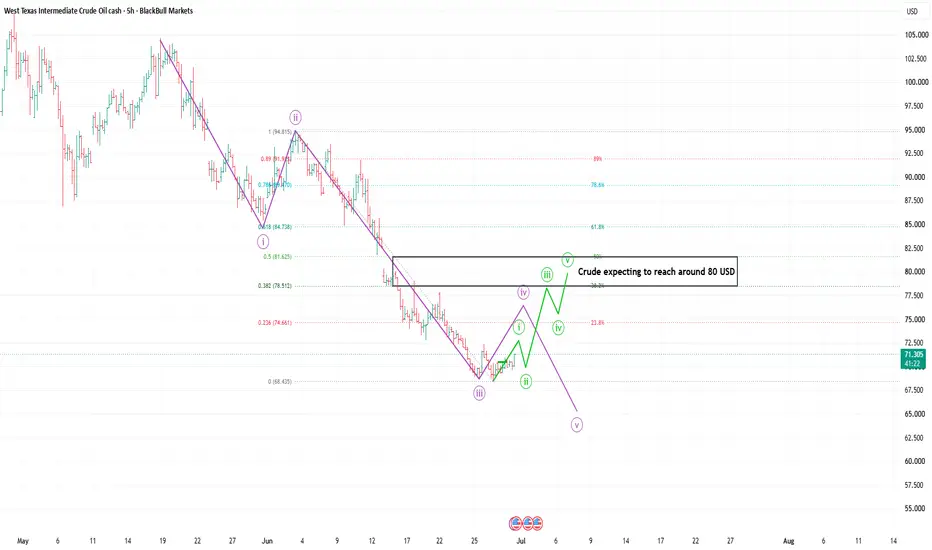
1. WTI Crude Oil remains in a **primary bearish trend**, with price continuing to form lower highs and lower lows below the falling trendline.
2. The Elliott Wave structure indicates that **Wave (ii) has likely completed**, and **Wave (iii)** appears to have ended near **$68.40**, initiating a corrective recovery.
3. The current bounce is likely developing as **Wave (iv)**, which could extend toward the **$79–$80 resistance zone** before the larger downtrend resumes.
4. Fibonacci retracement levels highlight **$78.50–$80.00** as a strong resistance area, where sellers are expected to re-enter the market.
5. The chart suggests a potential completion of Wave (iv) near **$80**, followed by the start of **Wave (v)** targeting fresh lows.
6. If Wave (v) unfolds as projected, Crude Oil could decline toward the **$66–$64** region, completing the current bearish Elliott Wave cycle.
7. The MACD histogram is gradually improving, indicating weakening bearish momentum; however, it has not yet confirmed a bullish trend reversal.
8. A sustained close above **$80** would strengthen the corrective rally and may delay the bearish scenario, while failure near this zone would reinforce the continuation of the downtrend.
9. Traders should monitor the **$79–$80 resistance zone** closely, as it offers the highest probability area for trend continuation under the current wave structure.
10. **Overall Outlook: Moderately Bearish (7.5/10)** with the expected path: **$71 → $75 → $80 (Wave iv) → $66–$64 (Wave v)**, unless Crude Oil establishes a decisive breakout above **$80**.
---
**Disclaimer:** This analysis is based on technical indicators, chart patterns, Elliott Wave interpretation, Fibonacci levels, and the current market structure. It is intended **solely for educational and informational purposes** and **should not be considered financial or investment advice**. Financial markets are inherently volatile, and no technical analysis can guarantee future price movements. Please conduct your own research and consult a qualified financial advisor before making any investment or trading decisions.
1. WTI Crude Oil remains in a **primary bearish trend**, with price continuing to form lower highs and lower lows below the falling trendline.
2. The Elliott Wave structure indicates that **Wave (ii) has likely completed**, and **Wave (iii)** appears to have ended near **$68.40**, initiating a corrective recovery.
3. The current bounce is likely developing as **Wave (iv)**, which could extend toward the **$79–$80 resistance zone** before the larger downtrend resumes.
4. Fibonacci retracement levels highlight **$78.50–$80.00** as a strong resistance area, where sellers are expected to re-enter the market.
5. The chart suggests a potential completion of Wave (iv) near **$80**, followed by the start of **Wave (v)** targeting fresh lows.
6. If Wave (v) unfolds as projected, Crude Oil could decline toward the **$66–$64** region, completing the current bearish Elliott Wave cycle.
7. The MACD histogram is gradually improving, indicating weakening bearish momentum; however, it has not yet confirmed a bullish trend reversal.
8. A sustained close above **$80** would strengthen the corrective rally and may delay the bearish scenario, while failure near this zone would reinforce the continuation of the downtrend.
9. Traders should monitor the **$79–$80 resistance zone** closely, as it offers the highest probability area for trend continuation under the current wave structure.
10. **Overall Outlook: Moderately Bearish (7.5/10)** with the expected path: **$71 → $75 → $80 (Wave iv) → $66–$64 (Wave v)**, unless Crude Oil establishes a decisive breakout above **$80**.
---
**Disclaimer:** This analysis is based on technical indicators, chart patterns, Elliott Wave interpretation, Fibonacci levels, and the current market structure. It is intended **solely for educational and informational purposes** and **should not be considered financial or investment advice**. Financial markets are inherently volatile, and no technical analysis can guarantee future price movements. Please conduct your own research and consult a qualified financial advisor before making any investment or trading decisions.

Disclaimer
The information and publications are not meant to be, and do not constitute, financial, investment, trading, or other types of advice or recommendations supplied or endorsed by TradingView. Read more in the Terms of Use.
Disclaimer
The information and publications are not meant to be, and do not constitute, financial, investment, trading, or other types of advice or recommendations supplied or endorsed by TradingView. Read more in the Terms of Use.