
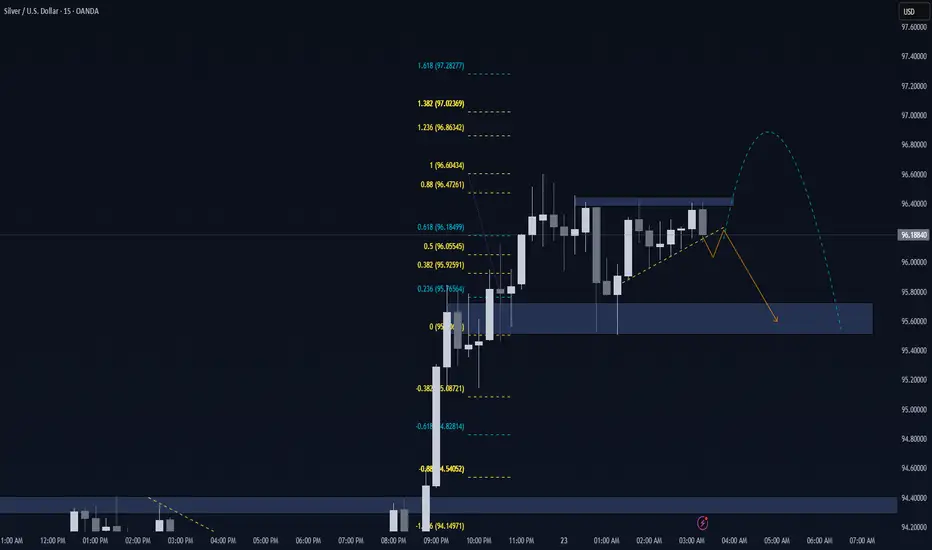
📌 Market Context (XAGUSD – 15m)
Strong impulsive bullish move from ~94.15 → ~96.40
Move is displacement (large candles, imbalance created)
After impulse → price goes range-bound / consolidation near highs
You’ve correctly marked:
Premium/discount via Fibonacci
Supply zone above (~96.40–96.50)
Demand zone below (~95.40–95.80)
This is a classic distribution after expansion structure.
🧠 What the Market Is Likely Doing
1️⃣ Liquidity Above First
Equal highs / range highs around 96.40
Smart money often sweeps buy-side liquidity before real move
That dashed blue curve you drew = ✔️ very realistic
Expectation:
👉 Small push above highs → stop hunt → rejection
🔻 Then the Real Move (High Probability)
After liquidity grab:
Market is already in premium
No fresh bullish displacement
Weak follow-through on highs
So probability favors:
➡️ Bearish rotation back into demand
Target zones:
TP1: 95.90 (range low / imbalance)
TP2: 95.60 (your demand zone)
TP3 (extended): 95.40 (discount equilibrium)
📐 Fibonacci Confluence (Very Important)
Price stalled near 0.618–0.88 premium
That’s an optimal sell zone (OTE for shorts) in a distribution phase
No clean BOS above the range → bullish structure is weak
🟡 Valid Scenarios (Keep This Simple)
✅ Scenario A – Best Sell Setup
Price taps 96.40–96.60
Shows:
Long upper wick
Bearish engulfing / displacement
Entry: on lower timeframe pullback
SL: above liquidity sweep
Target: demand zone (95.6–95.4)
⚠️ Scenario B – Invalidation
Clean 15m BOS + close above 96.60
Then price may continue to:
96.85
97.02
97.28 (fib extensions you marked)
No guessing — wait for structure.
Strong impulsive bullish move from ~94.15 → ~96.40
Move is displacement (large candles, imbalance created)
After impulse → price goes range-bound / consolidation near highs
You’ve correctly marked:
Premium/discount via Fibonacci
Supply zone above (~96.40–96.50)
Demand zone below (~95.40–95.80)
This is a classic distribution after expansion structure.
🧠 What the Market Is Likely Doing
1️⃣ Liquidity Above First
Equal highs / range highs around 96.40
Smart money often sweeps buy-side liquidity before real move
That dashed blue curve you drew = ✔️ very realistic
Expectation:
👉 Small push above highs → stop hunt → rejection
🔻 Then the Real Move (High Probability)
After liquidity grab:
Market is already in premium
No fresh bullish displacement
Weak follow-through on highs
So probability favors:
➡️ Bearish rotation back into demand
Target zones:
TP1: 95.90 (range low / imbalance)
TP2: 95.60 (your demand zone)
TP3 (extended): 95.40 (discount equilibrium)
📐 Fibonacci Confluence (Very Important)
Price stalled near 0.618–0.88 premium
That’s an optimal sell zone (OTE for shorts) in a distribution phase
No clean BOS above the range → bullish structure is weak
🟡 Valid Scenarios (Keep This Simple)
✅ Scenario A – Best Sell Setup
Price taps 96.40–96.60
Shows:
Long upper wick
Bearish engulfing / displacement
Entry: on lower timeframe pullback
SL: above liquidity sweep
Target: demand zone (95.6–95.4)
⚠️ Scenario B – Invalidation
Clean 15m BOS + close above 96.60
Then price may continue to:
96.85
97.02
97.28 (fib extensions you marked)
No guessing — wait for structure.

Disclaimer
The information and publications are not meant to be, and do not constitute, financial, investment, trading, or other types of advice or recommendations supplied or endorsed by TradingView. Read more in the Terms of Use.
Disclaimer
The information and publications are not meant to be, and do not constitute, financial, investment, trading, or other types of advice or recommendations supplied or endorsed by TradingView. Read more in the Terms of Use.