
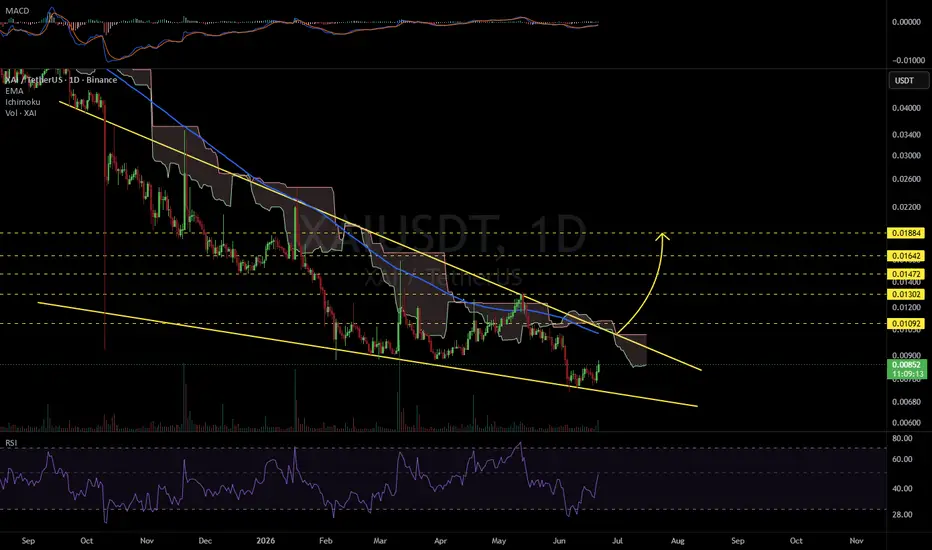
#XAI is moving inside a falling wedge pattern on the daily chart. In case of a breakout above the resistance cluster, which consists of the wedge resistance, the Ichimoku Cloud, and the daily EMA100, the potential upside targets are:
🎯 $0.01092
🎯 $0.01302
🎯 $0.01472
🎯 $0.01642
🎯 $0.01884
⚠️ Always remember to use a tight stop-loss and maintain proper risk management.
🎯 $0.01092
🎯 $0.01302
🎯 $0.01472
🎯 $0.01642
🎯 $0.01884
⚠️ Always remember to use a tight stop-loss and maintain proper risk management.

Disclaimer
The information and publications are not meant to be, and do not constitute, financial, investment, trading, or other types of advice or recommendations supplied or endorsed by TradingView. Read more in the Terms of Use.
Disclaimer
The information and publications are not meant to be, and do not constitute, financial, investment, trading, or other types of advice or recommendations supplied or endorsed by TradingView. Read more in the Terms of Use.