
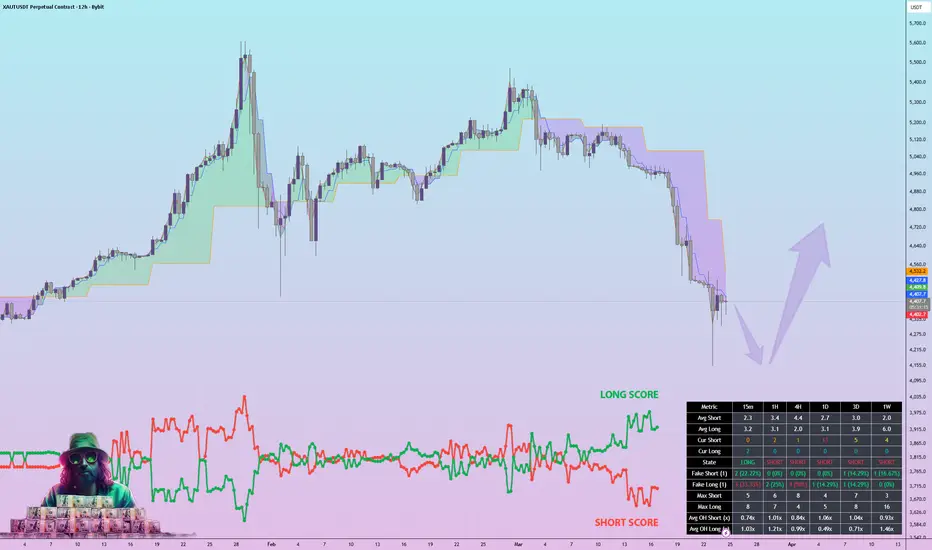
ALMA Long Add active: ~$4,350–$4,400 (24.03).
The March 16 XAUT long idea hit Hard SL. Closed -9.39%. XAUT kept falling — from $5,400 to $4,380, -19% total. The strategy is adding long again at the bottom. Score went from the initial setup to 58.8 — the highest reading in this series.
Here's the difference.
---
Score breakdown (58.8 total):
ALMA Overheat (Cur>Avg): 20.6
- 1D: 10.0 — 1D ALMA SHORT series at extreme length vs. average
- 1W: 6.0 — weekly ALMA SHORT overheat contributing
- 3D: 4.6 — 3D SHORT series also extended
Three timeframes simultaneously overheated. That's the setup. The 1D alone contributes more than the entire XMR score from March 19.
Deviation: 17.9

- 1D: 12.8 — price is ~13–15% below its 1D EMA. Not a small dip.
- 1H: 2.5, 3D: 2.5
The 1D deviation chart confirms it: the current 1D Dev% is at the highest reading in the entire dataset going back to December 2025. Price has never been this far from the 1D EMA during this gold run.
Series × 0.5: 2.5 — 1D and 4H contributing positively.
1st Bar Close: 2.5 — 1H confirmed below EMA on first bar.
SMC Class C: 0.8 — weak structure signal, honestly noted.
---
SMC / FVG (1D and 1W):

1D structure:
- MS CHoCH at $4,964.8 (15.03) — structure shifted bearish
- MS Trend Down confirmed at $4,964.8 (15.03)
- FVG Bull support floor: $4,025 (1D, major)
- Current price ~$4,380: sitting between MS Trend Down and first major support
- Overhead: FVG Bear zones stacked from $4,473 → $4,533 → $4,642 → $4,979–$5,007 → $5,026–$5,047

1W structure:
- MS BOS at $2,594.5 (Sept 2025) — weekly bullish pivot intact
- MS Trend Up at $3,364.0 (Apr 2025) — long-term structure bullish
- Weekly OB Bull zone: ~$3,800–$3,900 (deep but still active)
- The weekly trend has not broken. This is a correction inside a bull market, not a reversal.
Current price is holding above the 1D FVG Bull at $4,025. The question is whether it stabilizes here or tests the weekly OB.
---
Strategy mechanics (Long Only, 12H):
Entry condition: each 12H bar where ALMA signal = SHORT and (Cur S − Avg S) ≥ 1. Currently: Cur S=8, Avg S=4.1 → diff=3.9 — condition firmly met. Multiple adds active.
Position sizing: 25% of equity per bar. Max 4 adds (pyramiding=4) → up to 100% deployed.
Exit condition: ALMA signal = LONG and the subsequent LONG series becomes overheated: (Cur L − Avg L) ≥ 1. Strategy holds through the flip, exits when LONG phase is extended.
Hard stop: 10% from average entry price. The previous trade hit this level — that's what -9.39% was. Current adds are at lower prices, so the Hard SL level resets lower accordingly.
---
Context on the stop:
The March 16 idea entered at ~$4,800–$5,000. Hard SL at 10% = ~$4,320–$4,500. The selloff was sharp enough to trigger it. That's the cost of counter-trend averaging against a momentum move. Now the strategy re-enters at $4,380 — ~10% lower — with a 4× stronger score and the worst of the selling already priced in.
The Cur S charts tell the story: the short series is now at levels not seen in the entire 4-month data window. Every time this happened at lower magnitudes before, the ALMA Long averaged through it successfully. This is the most extreme reading to date.
12H ATR = 1.87%. 1D ATR = 3.25%. 3D ATR = 5.78%. Gold-backed token — lower volatility than pure crypto, but -19% moves happen.
The March 16 XAUT long idea hit Hard SL. Closed -9.39%. XAUT kept falling — from $5,400 to $4,380, -19% total. The strategy is adding long again at the bottom. Score went from the initial setup to 58.8 — the highest reading in this series.
Here's the difference.
---
Score breakdown (58.8 total):
ALMA Overheat (Cur>Avg): 20.6
- 1D: 10.0 — 1D ALMA SHORT series at extreme length vs. average
- 1W: 6.0 — weekly ALMA SHORT overheat contributing
- 3D: 4.6 — 3D SHORT series also extended
Three timeframes simultaneously overheated. That's the setup. The 1D alone contributes more than the entire XMR score from March 19.
Deviation: 17.9
- 1D: 12.8 — price is ~13–15% below its 1D EMA. Not a small dip.
- 1H: 2.5, 3D: 2.5
The 1D deviation chart confirms it: the current 1D Dev% is at the highest reading in the entire dataset going back to December 2025. Price has never been this far from the 1D EMA during this gold run.
Series × 0.5: 2.5 — 1D and 4H contributing positively.
1st Bar Close: 2.5 — 1H confirmed below EMA on first bar.
SMC Class C: 0.8 — weak structure signal, honestly noted.
---
SMC / FVG (1D and 1W):
1D structure:
- MS CHoCH at $4,964.8 (15.03) — structure shifted bearish
- MS Trend Down confirmed at $4,964.8 (15.03)
- FVG Bull support floor: $4,025 (1D, major)
- Current price ~$4,380: sitting between MS Trend Down and first major support
- Overhead: FVG Bear zones stacked from $4,473 → $4,533 → $4,642 → $4,979–$5,007 → $5,026–$5,047
1W structure:
- MS BOS at $2,594.5 (Sept 2025) — weekly bullish pivot intact
- MS Trend Up at $3,364.0 (Apr 2025) — long-term structure bullish
- Weekly OB Bull zone: ~$3,800–$3,900 (deep but still active)
- The weekly trend has not broken. This is a correction inside a bull market, not a reversal.
Current price is holding above the 1D FVG Bull at $4,025. The question is whether it stabilizes here or tests the weekly OB.
---
Strategy mechanics (Long Only, 12H):
Entry condition: each 12H bar where ALMA signal = SHORT and (Cur S − Avg S) ≥ 1. Currently: Cur S=8, Avg S=4.1 → diff=3.9 — condition firmly met. Multiple adds active.
Position sizing: 25% of equity per bar. Max 4 adds (pyramiding=4) → up to 100% deployed.
Exit condition: ALMA signal = LONG and the subsequent LONG series becomes overheated: (Cur L − Avg L) ≥ 1. Strategy holds through the flip, exits when LONG phase is extended.
Hard stop: 10% from average entry price. The previous trade hit this level — that's what -9.39% was. Current adds are at lower prices, so the Hard SL level resets lower accordingly.
---
Context on the stop:
The March 16 idea entered at ~$4,800–$5,000. Hard SL at 10% = ~$4,320–$4,500. The selloff was sharp enough to trigger it. That's the cost of counter-trend averaging against a momentum move. Now the strategy re-enters at $4,380 — ~10% lower — with a 4× stronger score and the worst of the selling already priced in.
The Cur S charts tell the story: the short series is now at levels not seen in the entire 4-month data window. Every time this happened at lower magnitudes before, the ALMA Long averaged through it successfully. This is the most extreme reading to date.
12H ATR = 1.87%. 1D ATR = 3.25%. 3D ATR = 5.78%. Gold-backed token — lower volatility than pure crypto, but -19% moves happen.

BoaBias / Goldfinch_song
Swing trader · bar-close systematic book
800+ TRADES · WR 60% · AVG HOLD 7D · AVG PNL 7% · MAX DD -3.4%
CRYPTO · STOCKS · INDICES · METALS
📈Sharing Ideas · indicators · strategies with honest stats · Educational only NFA
Swing trader · bar-close systematic book
800+ TRADES · WR 60% · AVG HOLD 7D · AVG PNL 7% · MAX DD -3.4%
CRYPTO · STOCKS · INDICES · METALS
📈Sharing Ideas · indicators · strategies with honest stats · Educational only NFA
Related publications
Disclaimer
The information and publications are not meant to be, and do not constitute, financial, investment, trading, or other types of advice or recommendations supplied or endorsed by TradingView. Read more in the Terms of Use.
BoaBias / Goldfinch_song
Swing trader · bar-close systematic book
800+ TRADES · WR 60% · AVG HOLD 7D · AVG PNL 7% · MAX DD -3.4%
CRYPTO · STOCKS · INDICES · METALS
📈Sharing Ideas · indicators · strategies with honest stats · Educational only NFA
Swing trader · bar-close systematic book
800+ TRADES · WR 60% · AVG HOLD 7D · AVG PNL 7% · MAX DD -3.4%
CRYPTO · STOCKS · INDICES · METALS
📈Sharing Ideas · indicators · strategies with honest stats · Educational only NFA
Related publications
Disclaimer
The information and publications are not meant to be, and do not constitute, financial, investment, trading, or other types of advice or recommendations supplied or endorsed by TradingView. Read more in the Terms of Use.