
◈ XAUUSD — Elliott Wave Recovery Above 4,350
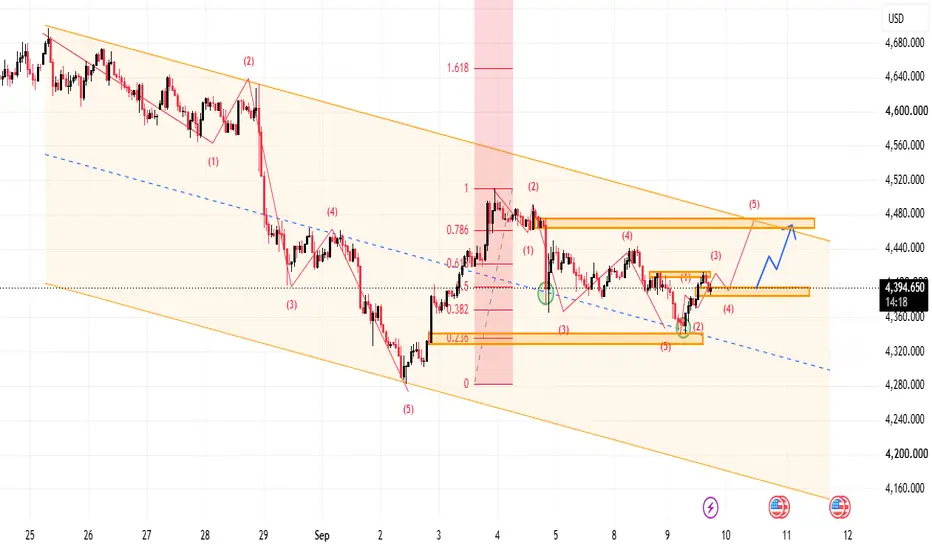
Gold is recovering again after bouncing from the one-week low area near 4,350. From Kelly’s view, the chart suggests that XAUUSD may be building a short-term bullish Elliott Wave structure, but buyers still need confirmation because price remains inside a larger descending channel.
The key idea is simple: geopolitical tension can continue to support safe-haven demand for gold, but the technical structure still needs a clean break above short-term resistance before the bullish wave becomes stronger.
⟡ Market structure
Gold is currently trading around 4,394, after reacting from the lower support area near 4,350–4,360. This reaction shows that buyers are trying to defend the correction low.
The current price is sitting near a short-term decision zone around 4,385–4,405. If gold holds above this area, the next bullish push may target 4,440–4,450 first, then the stronger resistance zone near 4,465–4,480.
The larger structure is still inside a descending channel, so the 4,465–4,480 area is very important. A clean breakout above this zone would support a stronger recovery toward 4,520–4,540.
➤ Key levels
◌ Current price area: 4,394
◌ Short-term buy zone: 4,385–4,405
◌ Key support: 4,350–4,360
◌ Deeper support: 4,320–4,330
◌ First resistance: 4,440–4,450
◌ Main breakout zone: 4,465–4,480
◌ Next upside target: 4,520–4,540
⌁ Elliott Wave view
The chart shows a possible bullish recovery after the previous bearish wave completed near 4,280.
Wave (1) may have formed from the lower support area.
Wave (2) corrected back toward 4,350–4,360 and found buyers.
If this low holds, wave (3) may push toward 4,440–4,450.
Wave (4) may create a short pullback near the current structure.
Wave (5) could extend toward 4,465–4,480, where the descending channel resistance is waiting.
If gold breaks above 4,480, the recovery structure becomes stronger and price may continue toward 4,520–4,540.
▸ Trading scenario
Preferred bullish scenario:
Entry: Buy around 4,385–4,405 if price gives bullish confirmation
Stop Loss: Below 4,350
Take Profit 1: 4,440–4,450
Take Profit 2: 4,465–4,480
Take Profit 3: 4,520–4,540
Alternative scenario:
If gold breaks below 4,350, the bullish wave setup becomes weaker. In that case, price may retest 4,320–4,330 before buyers try to rebuild the structure.
◌ Invalidation
The bullish view becomes weaker if gold loses 4,350 and fails to reclaim the current buy zone. A deeper break below 4,320 would shift short-term pressure back to the downside.
⌁ Kelly’s view
Kelly’s main view is cautiously bullish while gold holds above 4,350–4,360. The geopolitical background may continue to support gold, but the chart still needs confirmation above 4,440 and 4,480.
If buyers defend the current zone, gold may continue toward 4,465–4,480, then possibly 4,520–4,540.
Do you think gold will break the channel resistance, or retest 4,350 once more before the next rally?
Gold is recovering again after bouncing from the one-week low area near 4,350. From Kelly’s view, the chart suggests that XAUUSD may be building a short-term bullish Elliott Wave structure, but buyers still need confirmation because price remains inside a larger descending channel.
The key idea is simple: geopolitical tension can continue to support safe-haven demand for gold, but the technical structure still needs a clean break above short-term resistance before the bullish wave becomes stronger.
⟡ Market structure
Gold is currently trading around 4,394, after reacting from the lower support area near 4,350–4,360. This reaction shows that buyers are trying to defend the correction low.
The current price is sitting near a short-term decision zone around 4,385–4,405. If gold holds above this area, the next bullish push may target 4,440–4,450 first, then the stronger resistance zone near 4,465–4,480.
The larger structure is still inside a descending channel, so the 4,465–4,480 area is very important. A clean breakout above this zone would support a stronger recovery toward 4,520–4,540.
➤ Key levels
◌ Current price area: 4,394
◌ Short-term buy zone: 4,385–4,405
◌ Key support: 4,350–4,360
◌ Deeper support: 4,320–4,330
◌ First resistance: 4,440–4,450
◌ Main breakout zone: 4,465–4,480
◌ Next upside target: 4,520–4,540
⌁ Elliott Wave view
The chart shows a possible bullish recovery after the previous bearish wave completed near 4,280.
Wave (1) may have formed from the lower support area.
Wave (2) corrected back toward 4,350–4,360 and found buyers.
If this low holds, wave (3) may push toward 4,440–4,450.
Wave (4) may create a short pullback near the current structure.
Wave (5) could extend toward 4,465–4,480, where the descending channel resistance is waiting.
If gold breaks above 4,480, the recovery structure becomes stronger and price may continue toward 4,520–4,540.
▸ Trading scenario
Preferred bullish scenario:
Entry: Buy around 4,385–4,405 if price gives bullish confirmation
Stop Loss: Below 4,350
Take Profit 1: 4,440–4,450
Take Profit 2: 4,465–4,480
Take Profit 3: 4,520–4,540
Alternative scenario:
If gold breaks below 4,350, the bullish wave setup becomes weaker. In that case, price may retest 4,320–4,330 before buyers try to rebuild the structure.
◌ Invalidation
The bullish view becomes weaker if gold loses 4,350 and fails to reclaim the current buy zone. A deeper break below 4,320 would shift short-term pressure back to the downside.
⌁ Kelly’s view
Kelly’s main view is cautiously bullish while gold holds above 4,350–4,360. The geopolitical background may continue to support gold, but the chart still needs confirmation above 4,440 and 4,480.
If buyers defend the current zone, gold may continue toward 4,465–4,480, then possibly 4,520–4,540.
Do you think gold will break the channel resistance, or retest 4,350 once more before the next rally?

📌 New analysis published daily
🔔 Follow this profile for real-time updates
⚠️ This is personal analysis, not financial advice
Daily GOLD and Forex updates: t.me/+_8wydjUbci5hMzJl
🔔 Follow this profile for real-time updates
⚠️ This is personal analysis, not financial advice
Daily GOLD and Forex updates: t.me/+_8wydjUbci5hMzJl
Related publications
Disclaimer
The information and publications are not meant to be, and do not constitute, financial, investment, trading, or other types of advice or recommendations supplied or endorsed by TradingView. Read more in the Terms of Use.
📌 New analysis published daily
🔔 Follow this profile for real-time updates
⚠️ This is personal analysis, not financial advice
Daily GOLD and Forex updates: t.me/+_8wydjUbci5hMzJl
🔔 Follow this profile for real-time updates
⚠️ This is personal analysis, not financial advice
Daily GOLD and Forex updates: t.me/+_8wydjUbci5hMzJl
Related publications
Disclaimer
The information and publications are not meant to be, and do not constitute, financial, investment, trading, or other types of advice or recommendations supplied or endorsed by TradingView. Read more in the Terms of Use.