
XAUUSD — Corrective Recovery Testing Supply, Decision Zone Approaching
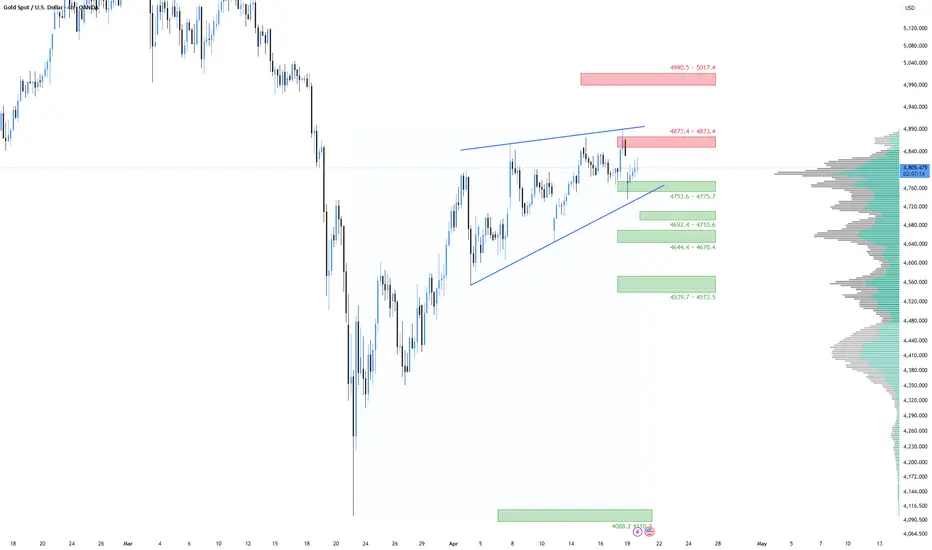
XAUUSD is now trading inside a corrective recovery phase after the sharp March displacement lower. The rebound has been structurally positive from the swing low, but the current leg is compressing directly beneath a defined supply zone, which keeps the market in a decision area rather than in confirmed bullish continuation.
Macro Context
The current macro mix is not fully supportive for gold in the short term.
Renewed U.S.–Iran tension has pushed oil prices higher, strengthened the U.S. dollar, and lifted Treasury yields. That matters because gold performs best when fear rises while yields and the dollar soften. At the moment, the market is pricing the inflationary side of the geopolitical shock more aggressively than the pure safe-haven side.
That creates a difficult environment for upside continuation:
So the broader regime is not cleanly bearish, but it is also not a clean bullish expansion regime. It is a headline-driven corrective environment with resistance still active.
Technical Structure Read
From a structural standpoint, the chart shows three important features:
This matters because impulsive bullish continuation usually shows clean acceptance through resistance. Here, price is still reacting under supply, which means the recovery remains vulnerable to rejection unless buyers can force acceptance above the local ceiling.
The volume profile also reinforces this interpretation. Price is trading around an active high-volume area rather than escaping into a fresh expansion leg. That usually means the market is still negotiating value, not yet repricing decisively higher.
Key Levels
Liquidity and Order-Flow Logic
The current area looks like a compression zone under supply, not a clean breakout base yet.
That means two-way liquidity is likely to be taken before the next directional move expands. If price cannot secure acceptance above 4873.4, the market can rotate lower to rebalance into 4753.6–4775.7 first. If that first support fails, the structure opens room toward the next demand layers at 4692 and 4644.
In other words, the market is close to a local ceiling while still sitting inside a corrective range. Until resistance is reclaimed with acceptance, upside remains conditional.
Bias Framework
Short-term bias: neutral to slightly bearish while price remains capped below 4873.4.
Medium-term bias: recovery remains valid only if price continues defending higher demand zones and avoids losing the rising corrective structure.
Narrative bias: gold is stabilizing after a major flush, but the recovery is currently corrective rather than impulsive.
Structural confirmation needed for bulls: acceptance above 4873.4, followed by continuation toward 4990.5–5017.4.
Structural confirmation needed for bears: rejection from current supply and a clean loss of 4753.6–4775.7.
Scenario Map
Scenario 1 — Bullish continuation
Continuation requires:
If that happens, the path opens toward:
This scenario becomes credible only after resistance turns into support. Without that acceptance, upside remains vulnerable to rejection.
Scenario 2 — Corrective rejection and deeper rotation
Rejection remains the more tactically relevant scenario while price is still capped below 4873.4.
This scenario strengthens if:
If that happens, downside rotation can extend into:
Conclusion
XAUUSD is still in recovery from the March low, but the current leg is trading like a corrective advance into supply rather than a confirmed bullish breakout. The market is now approaching a decision point.
As long as price remains below 4873.4, the chart remains vulnerable to a downside rotation back into lower demand. A clean acceptance above that resistance would invalidate the immediate pressure and shift focus toward the 4990.5 – 5017.4 zone.
For now, this chart is best classified as a corrective structure inside a broader decision range, with resistance overhead and support layers below waiting to define the next expansion.
XAUUSD is now trading inside a corrective recovery phase after the sharp March displacement lower. The rebound has been structurally positive from the swing low, but the current leg is compressing directly beneath a defined supply zone, which keeps the market in a decision area rather than in confirmed bullish continuation.
Macro Context
The current macro mix is not fully supportive for gold in the short term.
Renewed U.S.–Iran tension has pushed oil prices higher, strengthened the U.S. dollar, and lifted Treasury yields. That matters because gold performs best when fear rises while yields and the dollar soften. At the moment, the market is pricing the inflationary side of the geopolitical shock more aggressively than the pure safe-haven side.
That creates a difficult environment for upside continuation:
- higher oil keeps inflation concerns alive
- firmer USD pressures gold mechanically
- higher yields increase gold’s opportunity cost
- geopolitical risk still prevents a clean collapse
So the broader regime is not cleanly bearish, but it is also not a clean bullish expansion regime. It is a headline-driven corrective environment with resistance still active.
Technical Structure Read
From a structural standpoint, the chart shows three important features:
- a strong recovery from the March capitulation low
- an upward corrective structure with rising support
- price now pressing into a clear supply ceiling around 4873.4
This matters because impulsive bullish continuation usually shows clean acceptance through resistance. Here, price is still reacting under supply, which means the recovery remains vulnerable to rejection unless buyers can force acceptance above the local ceiling.
The volume profile also reinforces this interpretation. Price is trading around an active high-volume area rather than escaping into a fresh expansion leg. That usually means the market is still negotiating value, not yet repricing decisively higher.
Key Levels
- Immediate resistance: 4873.4
- Major resistance / expansion target: 4990.5 – 5017.4
- First support / decision demand: 4753.6 – 4775.7
- Second support: 4692.4 – 4710.6
- Third support: 4644.4 – 4670.4
- Deeper imbalance / major support: 4539.7 – 4573.5
Liquidity and Order-Flow Logic
The current area looks like a compression zone under supply, not a clean breakout base yet.
That means two-way liquidity is likely to be taken before the next directional move expands. If price cannot secure acceptance above 4873.4, the market can rotate lower to rebalance into 4753.6–4775.7 first. If that first support fails, the structure opens room toward the next demand layers at 4692 and 4644.
In other words, the market is close to a local ceiling while still sitting inside a corrective range. Until resistance is reclaimed with acceptance, upside remains conditional.
Bias Framework
Short-term bias: neutral to slightly bearish while price remains capped below 4873.4.
Medium-term bias: recovery remains valid only if price continues defending higher demand zones and avoids losing the rising corrective structure.
Narrative bias: gold is stabilizing after a major flush, but the recovery is currently corrective rather than impulsive.
Structural confirmation needed for bulls: acceptance above 4873.4, followed by continuation toward 4990.5–5017.4.
Structural confirmation needed for bears: rejection from current supply and a clean loss of 4753.6–4775.7.
Scenario Map
Scenario 1 — Bullish continuation
Continuation requires:
- price to hold above the first demand zone
- buyers to secure acceptance above 4873.4
- follow-through candles to confirm that the move is not just another corrective poke into supply
If that happens, the path opens toward:
- 4990.5
- 5017.4
This scenario becomes credible only after resistance turns into support. Without that acceptance, upside remains vulnerable to rejection.
Scenario 2 — Corrective rejection and deeper rotation
Rejection remains the more tactically relevant scenario while price is still capped below 4873.4.
This scenario strengthens if:
- price fails to hold current recovery structure
- the market loses 4753.6 – 4775.7
- selling pressure expands through the first demand zone instead of being absorbed
If that happens, downside rotation can extend into:
- 4692.4 – 4710.6
- 4644.4 – 4670.4
- 4539.7 – 4573.5 in a deeper correction
Conclusion
XAUUSD is still in recovery from the March low, but the current leg is trading like a corrective advance into supply rather than a confirmed bullish breakout. The market is now approaching a decision point.
As long as price remains below 4873.4, the chart remains vulnerable to a downside rotation back into lower demand. A clean acceptance above that resistance would invalidate the immediate pressure and shift focus toward the 4990.5 – 5017.4 zone.
For now, this chart is best classified as a corrective structure inside a broader decision range, with resistance overhead and support layers below waiting to define the next expansion.

For live market updates and high-probability setups, join my Telegram: t.me/G_Traders
Related publications
Disclaimer
The information and publications are not meant to be, and do not constitute, financial, investment, trading, or other types of advice or recommendations supplied or endorsed by TradingView. Read more in the Terms of Use.
For live market updates and high-probability setups, join my Telegram: t.me/G_Traders
Related publications
Disclaimer
The information and publications are not meant to be, and do not constitute, financial, investment, trading, or other types of advice or recommendations supplied or endorsed by TradingView. Read more in the Terms of Use.