
🌐Hello traders! I’m Jack Blackwell, with 15 years of experience in analysis and trading in the futures and forex markets. Below are my technical analysis views based on the current XAUUSD (4H and 1H timeframes) chart structure.
✅ 4-Hour Trend Analysis
From the 4-hour timeframe, gold has clearly broken above the upper boundary of the previous descending channel and has remained above the MA5, MA10, and MA20. This indicates that the short- to medium-term structure has shifted from bearish to sideways-to-bullish.
The current price is approaching the upper Bollinger Band on the 4-hour chart, where clear resistance is present. If gold can effectively hold above the 4081–4096 area, it may continue testing 4118 and possibly 4140. If it fails to hold, the price may first pull back toward 4068–4058 to confirm support.
✅ 1-Hour Trend Analysis
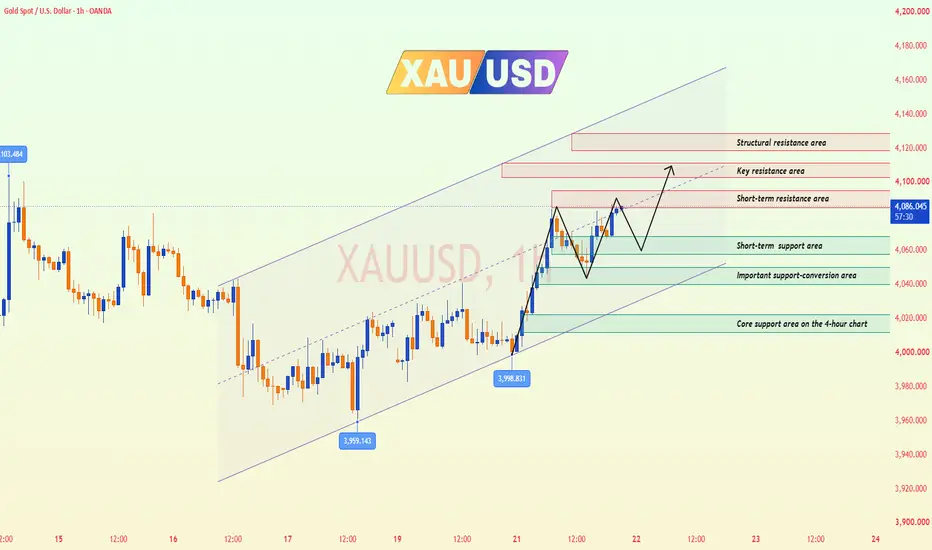
From the 1-hour timeframe, the moving averages are in a clear bullish alignment, indicating that the short-term trend remains strong. The price rebounded again after a pullback, showing strong buying support in the 4066–4056 area.
If gold breaks above and holds firmly over 4088, it is likely to test 4095–4100. If it fails to break higher and falls below 4065, the price may pull back toward 4056–4038.
🔴 Key Resistance Levels
● 4085–4095: Short-term resistance area
● 4118–4125: Structural resistance area
● 4139–4145: Important medium-term resistance
🟢 Key Support Levels
● 4068–4056: Short-term support area
● 4050–4038: Important support-conversion area
● 4018–4010: Core support area on the 4-hour chart
✅ Trading Strategy Reference
🔰 Buy-on-Pullback Strategy
👉 Buy Zone 1: 4068–4056
👉 Buy Zone 2: 4050–4038
🎯 Targets: 4088 → 4095 → 4118 → 4140
🔰 Short-Term Sell Strategy at Higher Levels
👉 Sell Zone 1: 4085–4095
👉 Sell Zone 2: 4115–4125
🎯 Targets: 4072 → 4065 → 4056 → 4038
⚠️ Both the 4-hour and 1-hour structures remain bullish, so long positions are still aligned with the prevailing trend. However, the price is already approaching resistance on both timeframes, so it is not advisable to chase long positions blindly above 4085. A more cautious approach is to wait for a pullback toward 4060–4050–4040 and consider buying only after support is confirmed.
🔔 If you find my analysis helpful, please like, share, and stay tuned for future updates. Your support is my motivation to continue sharing professional insights. Wishing everyone smooth trading and steady profits!
✅ 4-Hour Trend Analysis
From the 4-hour timeframe, gold has clearly broken above the upper boundary of the previous descending channel and has remained above the MA5, MA10, and MA20. This indicates that the short- to medium-term structure has shifted from bearish to sideways-to-bullish.
The current price is approaching the upper Bollinger Band on the 4-hour chart, where clear resistance is present. If gold can effectively hold above the 4081–4096 area, it may continue testing 4118 and possibly 4140. If it fails to hold, the price may first pull back toward 4068–4058 to confirm support.
✅ 1-Hour Trend Analysis
From the 1-hour timeframe, the moving averages are in a clear bullish alignment, indicating that the short-term trend remains strong. The price rebounded again after a pullback, showing strong buying support in the 4066–4056 area.
If gold breaks above and holds firmly over 4088, it is likely to test 4095–4100. If it fails to break higher and falls below 4065, the price may pull back toward 4056–4038.
🔴 Key Resistance Levels
● 4085–4095: Short-term resistance area
● 4118–4125: Structural resistance area
● 4139–4145: Important medium-term resistance
🟢 Key Support Levels
● 4068–4056: Short-term support area
● 4050–4038: Important support-conversion area
● 4018–4010: Core support area on the 4-hour chart
✅ Trading Strategy Reference
🔰 Buy-on-Pullback Strategy
👉 Buy Zone 1: 4068–4056
👉 Buy Zone 2: 4050–4038
🎯 Targets: 4088 → 4095 → 4118 → 4140
🔰 Short-Term Sell Strategy at Higher Levels
👉 Sell Zone 1: 4085–4095
👉 Sell Zone 2: 4115–4125
🎯 Targets: 4072 → 4065 → 4056 → 4038
⚠️ Both the 4-hour and 1-hour structures remain bullish, so long positions are still aligned with the prevailing trend. However, the price is already approaching resistance on both timeframes, so it is not advisable to chase long positions blindly above 4085. A more cautious approach is to wait for a pullback toward 4060–4050–4040 and consider buying only after support is confirmed.
🔔 If you find my analysis helpful, please like, share, and stay tuned for future updates. Your support is my motivation to continue sharing professional insights. Wishing everyone smooth trading and steady profits!

✅ Real-time professional trading guidance
✅ Clear and well-structured trading strategies
✅ 3–5 carefully selected trading signals per day
✅ Daily profit target of 500–1,000 pips
💎 VIP Guidance Channel:t.me/+CR7q5ko39YNjOWRl
✅ Clear and well-structured trading strategies
✅ 3–5 carefully selected trading signals per day
✅ Daily profit target of 500–1,000 pips
💎 VIP Guidance Channel:t.me/+CR7q5ko39YNjOWRl
Disclaimer
The information and publications are not meant to be, and do not constitute, financial, investment, trading, or other types of advice or recommendations supplied or endorsed by TradingView. Read more in the Terms of Use.
✅ Real-time professional trading guidance
✅ Clear and well-structured trading strategies
✅ 3–5 carefully selected trading signals per day
✅ Daily profit target of 500–1,000 pips
💎 VIP Guidance Channel:t.me/+CR7q5ko39YNjOWRl
✅ Clear and well-structured trading strategies
✅ 3–5 carefully selected trading signals per day
✅ Daily profit target of 500–1,000 pips
💎 VIP Guidance Channel:t.me/+CR7q5ko39YNjOWRl
Disclaimer
The information and publications are not meant to be, and do not constitute, financial, investment, trading, or other types of advice or recommendations supplied or endorsed by TradingView. Read more in the Terms of Use.