
Gold is bouncing from demand, but the next recovery faces two unresolved resistance zones. The key question is whether buyers can build a corrective advance before sellers regain control.
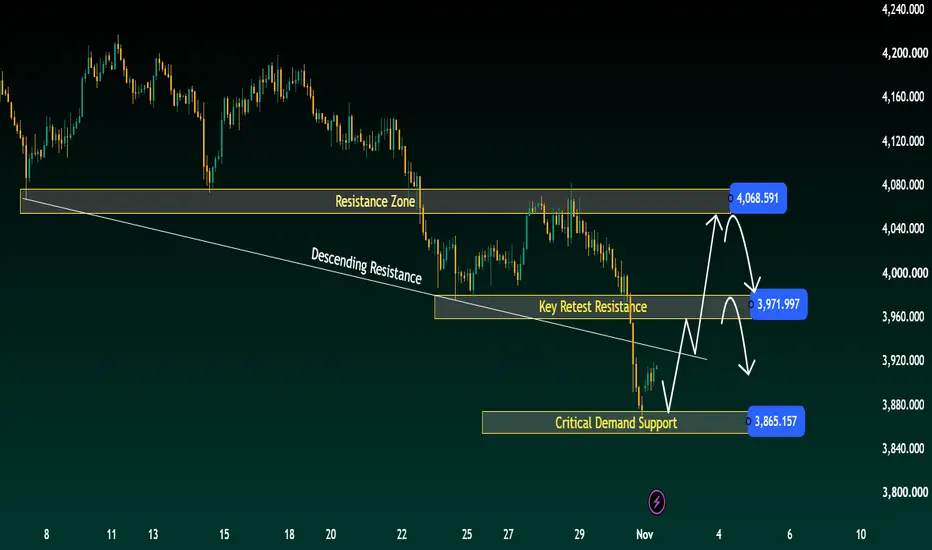
On the supplied H2 chart, the broader decline remains dominant. Price has broken beneath the former support area around 3,960–3,980 and accelerated toward demand around 3,855–3,875.
The initial bounce shows a reaction. It does not yet establish a completed bottom.
Wave Context — A Corrective Recovery Remains Possible
From an Elliott Wave perspective, the working hypothesis is that the latest downswing could give way to a corrective rebound within the broader decline.
However, the chart does not contain a labelled wave count. A completed five-wave decline or a confirmed A-B-C recovery cannot be established from the annotations alone.
The projected recovery path is therefore a scenario to monitor, not an already formed wave sequence.
Key Zones — Three Tests for the Next Move
• 3,855–3,875: Critical demand, with the marked reference at 3,865.157. Holding this area is central to the recovery scenario.
• 3,960–3,980: Former support and the first retest resistance zone, with the marked reference at 3,971.997.
• 4,055–4,075: Upper resistance, with the marked reference at 4,068.591. A deeper corrective recovery would face another important test here.
Zone boundaries are approximate readings from the chart; the reference prices are the exact labels shown.
Primary Scenario — Recovery Into Resistance
If demand holds, buyers could attempt a recovery toward the descending resistance line and then the 3,960–3,980 zone.
A rejection at this first barrier would keep a return toward 3,865.157 in focus.
If price instead closes above the zone on H2 and holds it on a subsequent retest, the corrective advance could extend toward 4,055–4,075.
Even that stronger recovery would need to be assessed carefully. Reaching upper resistance would not, by itself, confirm a new bullish impulse.
Alternative Scenario — Demand Fails Before Recovery Develops
An H2 close beneath the lower demand boundary, followed by a failed reclaim, would invalidate the immediate demand-led rebound scenario.
That would favour continued downside pressure rather than the projected recovery.
No lower target zone is marked on this chart, so a new downside objective would require an updated chart rather than an assumed extension.
Fibonacci — Confirmation Still Requires Anchors
The marked levels are price-zone references, not verified Fibonacci retracements or extensions.
Before identifying Fibonacci confluence, the relevant swing anchors need to be plotted. Before projecting a wave extension, the underlying wave structure needs to be established.
For this update, the focus is whether the recovery can progress through the marked resistance zones.
Invalidation and Reassessment
A sustained recovery above 4,055–4,075, followed by a successful retest, would weaken the immediate resistance-led bearish scenario.
That would justify reassessing the wave interpretation. It would not automatically confirm a completed larger correction.
The central message: demand can initiate a bounce, but the response at resistance will determine how much that bounce changes the outlook.
Would a rejection at the first retest zone support your corrective-wave view, or would you wait for the upper resistance test?
On the supplied H2 chart, the broader decline remains dominant. Price has broken beneath the former support area around 3,960–3,980 and accelerated toward demand around 3,855–3,875.
The initial bounce shows a reaction. It does not yet establish a completed bottom.
Wave Context — A Corrective Recovery Remains Possible
From an Elliott Wave perspective, the working hypothesis is that the latest downswing could give way to a corrective rebound within the broader decline.
However, the chart does not contain a labelled wave count. A completed five-wave decline or a confirmed A-B-C recovery cannot be established from the annotations alone.
The projected recovery path is therefore a scenario to monitor, not an already formed wave sequence.
Key Zones — Three Tests for the Next Move
• 3,855–3,875: Critical demand, with the marked reference at 3,865.157. Holding this area is central to the recovery scenario.
• 3,960–3,980: Former support and the first retest resistance zone, with the marked reference at 3,971.997.
• 4,055–4,075: Upper resistance, with the marked reference at 4,068.591. A deeper corrective recovery would face another important test here.
Zone boundaries are approximate readings from the chart; the reference prices are the exact labels shown.
Primary Scenario — Recovery Into Resistance
If demand holds, buyers could attempt a recovery toward the descending resistance line and then the 3,960–3,980 zone.
A rejection at this first barrier would keep a return toward 3,865.157 in focus.
If price instead closes above the zone on H2 and holds it on a subsequent retest, the corrective advance could extend toward 4,055–4,075.
Even that stronger recovery would need to be assessed carefully. Reaching upper resistance would not, by itself, confirm a new bullish impulse.
Alternative Scenario — Demand Fails Before Recovery Develops
An H2 close beneath the lower demand boundary, followed by a failed reclaim, would invalidate the immediate demand-led rebound scenario.
That would favour continued downside pressure rather than the projected recovery.
No lower target zone is marked on this chart, so a new downside objective would require an updated chart rather than an assumed extension.
Fibonacci — Confirmation Still Requires Anchors
The marked levels are price-zone references, not verified Fibonacci retracements or extensions.
Before identifying Fibonacci confluence, the relevant swing anchors need to be plotted. Before projecting a wave extension, the underlying wave structure needs to be established.
For this update, the focus is whether the recovery can progress through the marked resistance zones.
Invalidation and Reassessment
A sustained recovery above 4,055–4,075, followed by a successful retest, would weaken the immediate resistance-led bearish scenario.
That would justify reassessing the wave interpretation. It would not automatically confirm a completed larger correction.
The central message: demand can initiate a bounce, but the response at resistance will determine how much that bounce changes the outlook.
Would a rejection at the first retest zone support your corrective-wave view, or would you wait for the upper resistance test?
Trade active
Gold has moved in line with the original bearish outlook, rejecting higher resistance and extending its decline toward the critical demand area around 3,865.157. The subsequent rebound remains corrective, with price still trading below the key retest resistance at 3,971.997.
The next focus is a potential rejection from this resistance, followed by renewed pressure toward 3,876–3,865.
A sustained breakout above 3,971.997 would weaken the immediate bearish scenario, while a recovery beyond 4,068.591 would invalidate the broader bearish outlook.
The plan remains active, with confirmation guiding the next move.

Related publications
Disclaimer
The information and publications are not meant to be, and do not constitute, financial, investment, trading, or other types of advice or recommendations supplied or endorsed by TradingView. Read more in the Terms of Use.
Related publications
Disclaimer
The information and publications are not meant to be, and do not constitute, financial, investment, trading, or other types of advice or recommendations supplied or endorsed by TradingView. Read more in the Terms of Use.