
🌐Hello traders! I’m Jack Blackwell, with 15 years of experience in analysis and trading in the futures and forex markets. Below are my technical analysis views based on the current XAUUSD (4H and 1H timeframes) chart structure.
✅ 4-Hour Trend Analysis
From the 4-hour chart, gold entered a clear correction phase after reaching a high of 4382 and remains within a broader corrective structure. Although the price found support around the 4120 area and staged a rebound, the recovery has been relatively weak. Gold is still trading below the 4-hour MA20, indicating that medium-term bearish pressure remains intact.
At this stage, the market appears to be undergoing a consolidation and recovery process following the recent decline rather than signaling a genuine trend reversal. Therefore, the broader outlook remains bearish.
✅ 1-Hour Trend Analysis
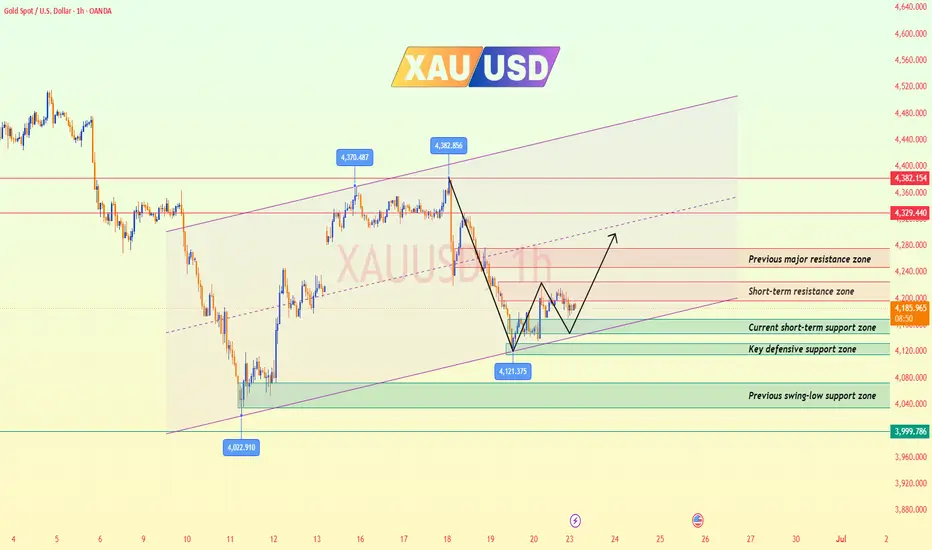
Looking at the 1-hour chart, gold has been consolidating within a range between 4160 and 4215 since rebounding from the 4121 area. Short-term moving averages have gradually flattened, while MACD momentum continues to weaken, suggesting that bulls and bears are currently in equilibrium and the market is awaiting a fresh directional catalyst.
In the short term, the 4200–4215 zone remains a key resistance area. If the price fails to break above this region decisively, sellers may regain control and push gold back toward the 4160 and potentially 4136 support levels.
On the other hand, if gold manages to establish itself above 4215, the rebound could extend further toward the 4250 area.
🔴 Key Resistance Levels
● 4200–4215 (Current primary resistance zone)
● 4250–4260 (Previous major resistance zone)
● 4297–4310 (Strong structural resistance zone)
🟢 Key Support Levels
● 4163–4156 (Current short-term support zone)
● 4136–4118 (Key defensive support zone)
● 4072–4035 (Previous swing-low support zone)
● 4000 (Major psychological support level)
📈 Trading Strategy Reference
🔰 Short Position Strategy (Sell the Rally)
👉 Sell Zone 1: 4200–4215
👉 Sell Zone 2: 4250–4260
🎯 Targets: 4163 → 4136 → 4118
📍 Rationale:
• The 4-hour MA20 continues to act as resistance.
• The broader market structure remains within a descending channel.
• Significant overhead supply and trapped long positions remain above 4200.
🔰 Long Position Strategy (Buy the Dip)
👉 Buy Zone 1: 4163–4156
👉 Buy Zone 2: 4136–4118
🎯 Targets: 4200 → 4215 → 4250
📍 Rationale:
• Price is currently trading near an important support zone.
• Support is present near the lower-middle section of the 4-hour Bollinger Bands.
• A confirmed stabilization with increased buying volume could trigger a technical rebound.
⚠️ Trend Outlook
👉 If gold breaks below 4136 and closes decisively beneath this level, bearish momentum could accelerate toward 4118, followed by 4072 and 4035.
👉 If the price breaks above and holds firmly above 4215, the short-term recovery could extend toward the 4250–4260 resistance zone.
👉 Based on the current 4-hour and 1-hour market structures, the broader trend remains bearish while the short-term outlook is characterized by consolidation. Traders should closely monitor the 4136 and 4215 levels, as a breakout from either side is likely to determine the next directional move.
🔔 Gold market conditions change rapidly, and seizing opportunities is essential!
If you feel confused or uncertain about the current market trend, you can follow our trading approach and gain access to real-time trading signals, professional strategy support, and in-depth market analysis. We are here to help you improve your trading efficiency, navigate the markets with greater confidence, and achieve more consistent and stable trading results.
✅ 4-Hour Trend Analysis
From the 4-hour chart, gold entered a clear correction phase after reaching a high of 4382 and remains within a broader corrective structure. Although the price found support around the 4120 area and staged a rebound, the recovery has been relatively weak. Gold is still trading below the 4-hour MA20, indicating that medium-term bearish pressure remains intact.
At this stage, the market appears to be undergoing a consolidation and recovery process following the recent decline rather than signaling a genuine trend reversal. Therefore, the broader outlook remains bearish.
✅ 1-Hour Trend Analysis
Looking at the 1-hour chart, gold has been consolidating within a range between 4160 and 4215 since rebounding from the 4121 area. Short-term moving averages have gradually flattened, while MACD momentum continues to weaken, suggesting that bulls and bears are currently in equilibrium and the market is awaiting a fresh directional catalyst.
In the short term, the 4200–4215 zone remains a key resistance area. If the price fails to break above this region decisively, sellers may regain control and push gold back toward the 4160 and potentially 4136 support levels.
On the other hand, if gold manages to establish itself above 4215, the rebound could extend further toward the 4250 area.
🔴 Key Resistance Levels
● 4200–4215 (Current primary resistance zone)
● 4250–4260 (Previous major resistance zone)
● 4297–4310 (Strong structural resistance zone)
🟢 Key Support Levels
● 4163–4156 (Current short-term support zone)
● 4136–4118 (Key defensive support zone)
● 4072–4035 (Previous swing-low support zone)
● 4000 (Major psychological support level)
📈 Trading Strategy Reference
🔰 Short Position Strategy (Sell the Rally)
👉 Sell Zone 1: 4200–4215
👉 Sell Zone 2: 4250–4260
🎯 Targets: 4163 → 4136 → 4118
📍 Rationale:
• The 4-hour MA20 continues to act as resistance.
• The broader market structure remains within a descending channel.
• Significant overhead supply and trapped long positions remain above 4200.
🔰 Long Position Strategy (Buy the Dip)
👉 Buy Zone 1: 4163–4156
👉 Buy Zone 2: 4136–4118
🎯 Targets: 4200 → 4215 → 4250
📍 Rationale:
• Price is currently trading near an important support zone.
• Support is present near the lower-middle section of the 4-hour Bollinger Bands.
• A confirmed stabilization with increased buying volume could trigger a technical rebound.
⚠️ Trend Outlook
👉 If gold breaks below 4136 and closes decisively beneath this level, bearish momentum could accelerate toward 4118, followed by 4072 and 4035.
👉 If the price breaks above and holds firmly above 4215, the short-term recovery could extend toward the 4250–4260 resistance zone.
👉 Based on the current 4-hour and 1-hour market structures, the broader trend remains bearish while the short-term outlook is characterized by consolidation. Traders should closely monitor the 4136 and 4215 levels, as a breakout from either side is likely to determine the next directional move.
🔔 Gold market conditions change rapidly, and seizing opportunities is essential!
If you feel confused or uncertain about the current market trend, you can follow our trading approach and gain access to real-time trading signals, professional strategy support, and in-depth market analysis. We are here to help you improve your trading efficiency, navigate the markets with greater confidence, and achieve more consistent and stable trading results.

Disclaimer
The information and publications are not meant to be, and do not constitute, financial, investment, trading, or other types of advice or recommendations supplied or endorsed by TradingView. Read more in the Terms of Use.
Disclaimer
The information and publications are not meant to be, and do not constitute, financial, investment, trading, or other types of advice or recommendations supplied or endorsed by TradingView. Read more in the Terms of Use.