
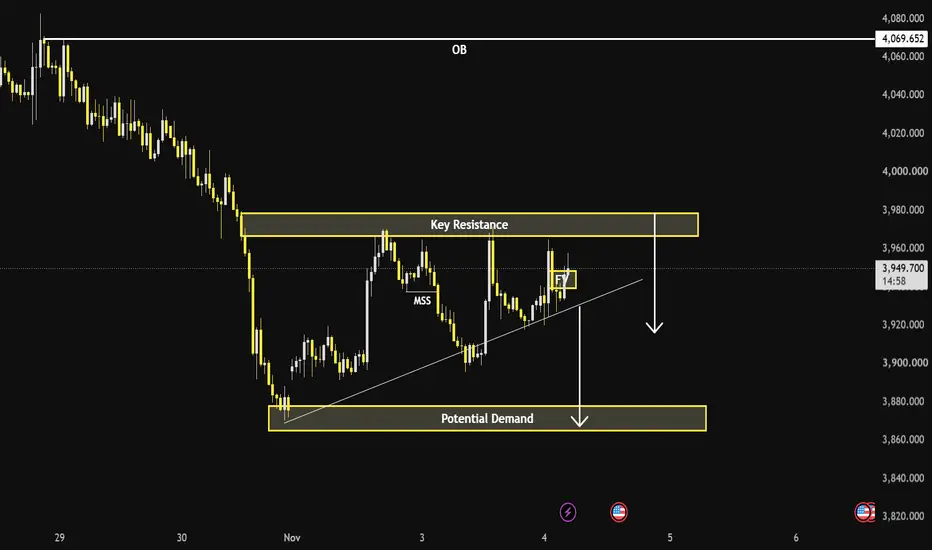
Gold is building short-term higher lows, but buyers are still struggling beneath a major resistance zone. Could this recovery turn into another lower high before sellers regain control?
Market Structure — A Recovery Within the Downtrend
XAUUSD continues to reflect a broader bearish structure following its decline from the 4,069 region.
The recent recovery from 3,865–3,878 potential demand has produced a rising support trendline and a series of short-term higher lows.
However, repeated failures to sustain a breakout near 3,960 suggest that the recovery remains vulnerable.
Price is currently near 3,936.410 on the referenced chart.
Bearish Scenario — Will Support Break?
The immediate recovery zone around 3,940–3,947 remains important.
If buyers fail to maintain momentum, another lower high could emerge beneath 3,966–3,978 key resistance.
A confirmed breakdown below the rising trendline and nearby support around 3,918–3,925 would weaken the short-term bullish structure.
Under this scenario, sellers could revisit the 3,865–3,878 demand zone.
Bullish Scenario — What Would Change the Outlook?
If Gold defends the rising trendline and breaks above 3,947, another attempt toward key resistance becomes possible.
A sustained breakout above 3,978, followed by a successful retest and a confirmed higher low, would strengthen the bullish recovery case.
Until then, the broader bearish structure remains unresolved.
The Bigger Picture
Gold edged higher in early Asian trading as softer oil prices eased inflation concerns.
However, Federal Reserve expectations and upcoming US employment data could continue influencing market volatility.
Higher lows suggest recovery. Breaking the lower-high sequence is what challenges the downtrend.
Will Gold reclaim resistance, or is another bearish leg developing?
Market Structure — A Recovery Within the Downtrend
XAUUSD continues to reflect a broader bearish structure following its decline from the 4,069 region.
The recent recovery from 3,865–3,878 potential demand has produced a rising support trendline and a series of short-term higher lows.
However, repeated failures to sustain a breakout near 3,960 suggest that the recovery remains vulnerable.
Price is currently near 3,936.410 on the referenced chart.
Bearish Scenario — Will Support Break?
The immediate recovery zone around 3,940–3,947 remains important.
If buyers fail to maintain momentum, another lower high could emerge beneath 3,966–3,978 key resistance.
A confirmed breakdown below the rising trendline and nearby support around 3,918–3,925 would weaken the short-term bullish structure.
Under this scenario, sellers could revisit the 3,865–3,878 demand zone.
Bullish Scenario — What Would Change the Outlook?
If Gold defends the rising trendline and breaks above 3,947, another attempt toward key resistance becomes possible.
A sustained breakout above 3,978, followed by a successful retest and a confirmed higher low, would strengthen the bullish recovery case.
Until then, the broader bearish structure remains unresolved.
The Bigger Picture
Gold edged higher in early Asian trading as softer oil prices eased inflation concerns.
However, Federal Reserve expectations and upcoming US employment data could continue influencing market volatility.
Higher lows suggest recovery. Breaking the lower-high sequence is what challenges the downtrend.
Will Gold reclaim resistance, or is another bearish leg developing?
Trade closed manually
XAUUSD — Closed Manually | Plan Concluded
Gold developed a strong bullish structure shift, breaking above the 3,966–3,978 key resistance zone and extending beyond 4,069.652.
The recovery accelerated toward 4,140, with higher highs and higher lows replacing the previous bearish structure.
The original plan is now closed manually.
Looking ahead, 4,069.652 becomes an important support reference. Holding above this level could support another bullish continuation attempt, while a confirmed breakdown would increase the risk of a deeper correction.
Further price action will be evaluated under a new plan.

Related publications
Disclaimer
The information and publications are not meant to be, and do not constitute, financial, investment, trading, or other types of advice or recommendations supplied or endorsed by TradingView. Read more in the Terms of Use.
Related publications
Disclaimer
The information and publications are not meant to be, and do not constitute, financial, investment, trading, or other types of advice or recommendations supplied or endorsed by TradingView. Read more in the Terms of Use.