
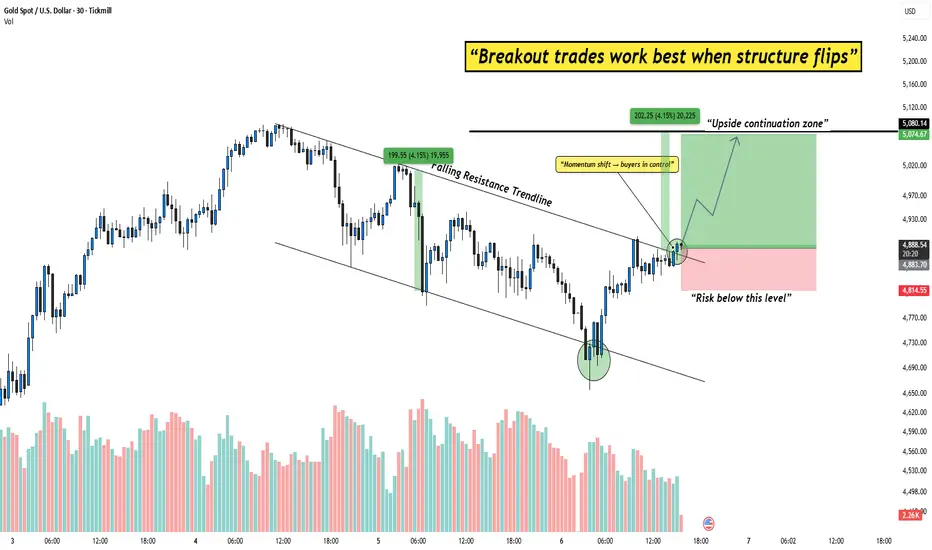
Gold has finally broken above the falling resistance trendline, and more importantly, the market structure has flipped. This is the key reason why breakout trades start working better after long corrections.
Earlier, price was respecting the falling trendline, but once sellers failed to push it lower, buyers stepped in with strength. The breakout candle shows a clear momentum shift, and price is now holding above the previous resistance area.
This zone is important. As long as price stays above it, the bias remains bullish, and the upside continuation zone becomes active. Pullbacks into this area are not weakness, they are retests.
However, if price fails to hold below the marked risk zone, the breakout idea gets invalidated. Until then, the structure favors buyers.
Strong trends don’t reverse instantly, they pause, flip structure, and then continue.
What I’m Watching now on chart:
Rahul’s Insight:
Most traders chase breakouts too early. The real edge comes when structure flips and holds, not just when a line breaks.
Disclaimer:This analysis is for educational purposes only and should not be considered financial advice. Markets involve risk. Please do your own analysis and manage risk properly before taking any trade.
Earlier, price was respecting the falling trendline, but once sellers failed to push it lower, buyers stepped in with strength. The breakout candle shows a clear momentum shift, and price is now holding above the previous resistance area.
This zone is important. As long as price stays above it, the bias remains bullish, and the upside continuation zone becomes active. Pullbacks into this area are not weakness, they are retests.
However, if price fails to hold below the marked risk zone, the breakout idea gets invalidated. Until then, the structure favors buyers.
Strong trends don’t reverse instantly, they pause, flip structure, and then continue.
What I’m Watching now on chart:
- Breakout Level: Falling resistance trendline
- Bullish Sign: Strong close and hold above breakout
- Upside Zone: Green highlighted area
- Risk Area: Below the red zone
Rahul’s Insight:
Most traders chase breakouts too early. The real edge comes when structure flips and holds, not just when a line breaks.
Disclaimer:This analysis is for educational purposes only and should not be considered financial advice. Markets involve risk. Please do your own analysis and manage risk properly before taking any trade.
Trade active
Gold given good move on friday, hopefully it will continue towards our target on monday.
Trade closed: target reached
Targets coming soon.

Related publications
Disclaimer
The information and publications are not meant to be, and do not constitute, financial, investment, trading, or other types of advice or recommendations supplied or endorsed by TradingView. Read more in the Terms of Use.
Related publications
Disclaimer
The information and publications are not meant to be, and do not constitute, financial, investment, trading, or other types of advice or recommendations supplied or endorsed by TradingView. Read more in the Terms of Use.