
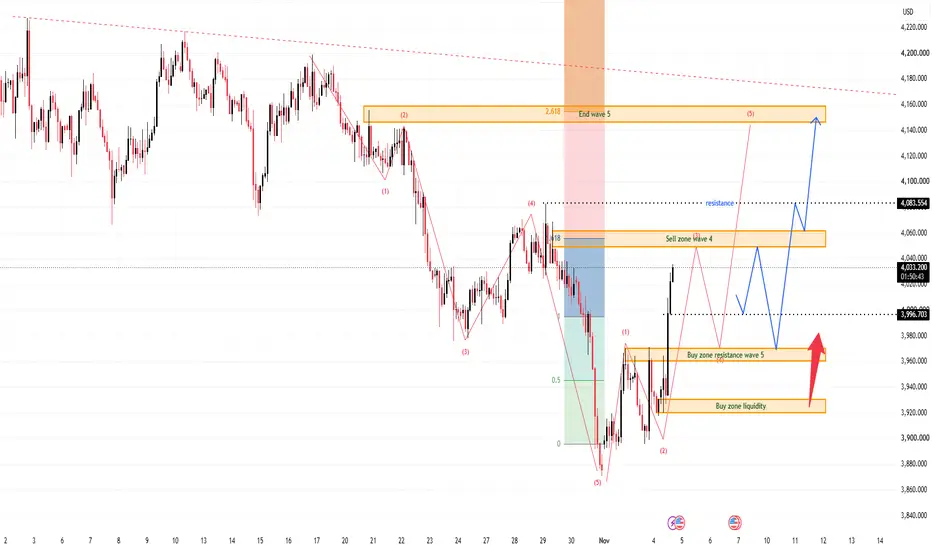
From Kelly’s view, gold is rebuilding a bullish structure after the strong recovery from the 3,865–3,900 area. Price is currently trading around 4,026, and the latest rebound suggests buyers are attempting to establish a new impulsive sequence above the recent liquidity base.
The key idea is simple: if gold continues to defend the 3,960–3,970 buy zone, the bullish structure may extend toward 4,050–4,060, 4,083, and eventually the larger 4,145–4,155 Wave (5) target zone.
⟡ Market structure
Gold has recovered sharply from the recent low near 3,865 and is beginning to form a sequence of higher lows.
The first important support sits around 3,960–3,970, where the chart marks a key reaction zone for the next bullish leg.
Below that, the deeper 3,920–3,930 liquidity zone remains the stronger structural support. As long as buyers continue to defend this area, the bullish recovery structure may stay valid.
On the upside, 4,050–4,060 is the first major resistance zone. A confirmed breakout above this area could expose 4,083.
If buyers also clear 4,083, the larger Wave (5) projection points toward the 4,145–4,155 Fibonacci target zone.
➤ Key levels
◌ Current price area: 4,020–4,030
◌ Main buy zone: 3,960–3,970
◌ Liquidity buy zone: 3,920–3,930
◌ Strong support: 3,920
◌ First resistance: 4,050–4,060
◌ Strong resistance: 4,083
◌ First target: 4,050–4,060
◌ Second target: 4,083
◌ Main target: 4,145–4,155
◌ Invalidation: Below 3,920
⌁ Elliott Wave view
Wave (1): The first bullish impulse developed from the 3,865 area and pushed gold toward approximately 3,970.
Wave (2): Price corrected back toward the lower liquidity structure before buyers returned.
Wave (3): The next bullish expansion may extend toward the 4,050–4,060 resistance zone.
Wave (4): A controlled pullback could then bring price back toward approximately 3,960–3,980.
Wave (5): If buyers defend the Wave (4) correction, the final bullish leg may break 4,083 and extend toward the 4,145–4,155 Fibonacci target area.
▸ Trading scenario
Preferred bullish scenario
Entry: 3,960–3,970 after bullish confirmation
Stop Loss: Below 3,920
Take Profit 1: 4,050–4,060
Take Profit 2: 4,083
Take Profit 3: 4,145–4,155
The cleaner plan is to wait for a controlled pullback into the main buy zone rather than chase price directly into resistance.
A bullish reaction from 3,960–3,970, followed by a reclaim of 4,000, would strengthen the continuation scenario. A confirmed break above 4,060 could then open the path toward 4,083 and the larger Wave (5) objective.
Alternative scenario:
If gold retraces deeper into the 3,920–3,930 liquidity zone but buyers continue to defend this structure, the bullish scenario may remain valid and the next impulsive move could begin from the lower support area.
◌ Invalidation
The bullish structure would weaken if price loses 3,960 without a meaningful reaction.
A sustained break below the 3,920 liquidity zone would invalidate the preferred bullish sequence and suggest that the recovery structure needs to be reassessed.
⌁ Kelly’s view
Kelly’s main view remains bullish while gold holds above the 3,920–3,970 support structure.
The first important upside challenge is 4,050–4,060, followed by 4,083. If buyers clear both resistance levels while maintaining higher lows, the larger 4,145–4,155 Wave (5) target may come into focus.
Do you think gold will retest the 3,960–3,970 buy zone first, or break 4,060 before the next pullback?
Trade closed: target reached
Gold has continued to move higher in line with the previous bullish plan, confirming strong buyer momentum after the rebound from the lower liquidity zone. Price has now pushed through the 4,045–4,060 area and is trading toward the next resistance around 4,083.
From Kelly’s view, the upside structure remains active while price holds above the key support zones below. If momentum continues, Gold could extend toward the 4,145–4,155 Wave 5 completion area, where a stronger reaction may begin to appear.

📌 New analysis published daily
🔔 Follow this profile for real-time updates
⚠️ This is personal analysis, not financial advice
Daily GOLD and Forex updates: t.me/+_8wydjUbci5hMzJl
🔔 Follow this profile for real-time updates
⚠️ This is personal analysis, not financial advice
Daily GOLD and Forex updates: t.me/+_8wydjUbci5hMzJl
Related publications
Disclaimer
The information and publications are not meant to be, and do not constitute, financial, investment, trading, or other types of advice or recommendations supplied or endorsed by TradingView. Read more in the Terms of Use.
📌 New analysis published daily
🔔 Follow this profile for real-time updates
⚠️ This is personal analysis, not financial advice
Daily GOLD and Forex updates: t.me/+_8wydjUbci5hMzJl
🔔 Follow this profile for real-time updates
⚠️ This is personal analysis, not financial advice
Daily GOLD and Forex updates: t.me/+_8wydjUbci5hMzJl
Related publications
Disclaimer
The information and publications are not meant to be, and do not constitute, financial, investment, trading, or other types of advice or recommendations supplied or endorsed by TradingView. Read more in the Terms of Use.