
XAUUSD — Bearish Structure Below 4,600
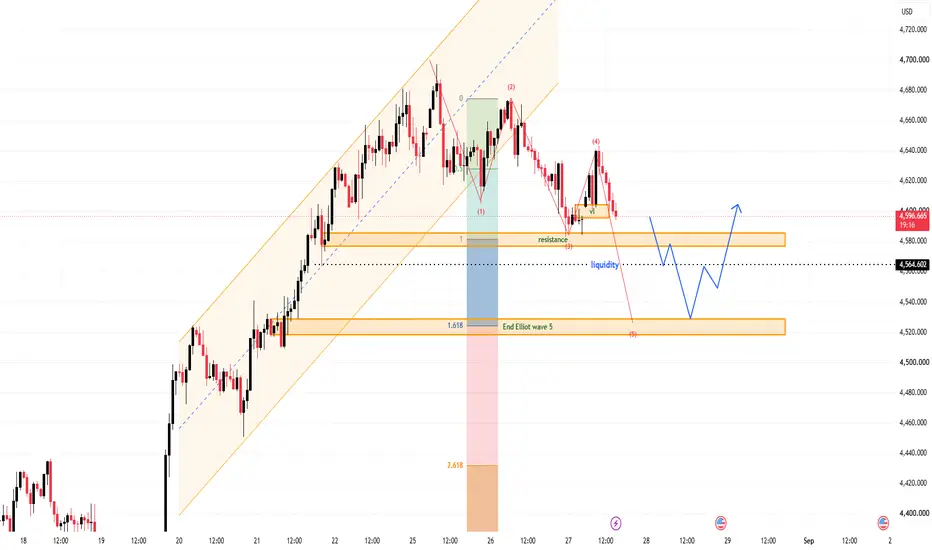
Gold is starting to lose upside momentum after rejecting from the upper side of the rising channel. From this chart, the latest rebound still looks corrective, which keeps the short-term bias tilted to the downside and supports the idea of one more bearish leg.
⟡ Market structure
Price previously advanced inside an ascending channel, but after peaking near the upper boundary, momentum faded and the market began to print a weaker lower-high sequence. The Elliott Wave structure on the chart suggests wave (3) has already pushed down, wave (4) is forming as a recovery bounce, and wave (5) may still develop lower if sellers stay in control.
The first important reaction area is around 4,579–4,585, which is acting as a key decision zone. Below that, the next liquidity level sits near 4,564.602. If this level breaks cleanly, gold could continue toward the 4,520–4,525 area, where the chart marks the projected Elliott wave 5 completion and Fibonacci 1.618 target.
➤ Key levels
◌ Current price area: 4,598
◌ Reaction / decision zone: 4,579–4,585
◌ Liquidity support: 4,564.602
◌ Main bearish target: 4,520–4,525
◌ Extension target if selling accelerates: around 4,433
◌ Invalidation resistance: 4,630–4,640
⌁ Trading scenario
Entry: Sell on bearish rejection around 4,598–4,605, or after price drops back below 4,585 and retests it weakly.
Stop Loss: Above 4,640
Take Profit 1: 4,564.602
Take Profit 2: 4,520–4,525
Take Profit 3: around 4,433 if wave 5 extends further
This setup stays valid while gold remains capped below the recent lower-high area and fails to reclaim bullish momentum.
◌ Invalidation
If buyers push price back above 4,630–4,640 and hold there, the bearish wave count becomes weaker. In that case, the current downside scenario may be delayed or invalidated.
▸ Final view
Kelly’s main view remains bearish for now. The chart still supports a corrective bounce first, followed by another move lower toward liquidity and the projected wave 5 completion zone. As long as gold stays below the recent swing-high resistance, rallies are still more likely to be sold than chased higher.
Do you think gold will complete wave (5) first, or can buyers defend the structure and force a stronger recovery?
Gold is starting to lose upside momentum after rejecting from the upper side of the rising channel. From this chart, the latest rebound still looks corrective, which keeps the short-term bias tilted to the downside and supports the idea of one more bearish leg.
⟡ Market structure
Price previously advanced inside an ascending channel, but after peaking near the upper boundary, momentum faded and the market began to print a weaker lower-high sequence. The Elliott Wave structure on the chart suggests wave (3) has already pushed down, wave (4) is forming as a recovery bounce, and wave (5) may still develop lower if sellers stay in control.
The first important reaction area is around 4,579–4,585, which is acting as a key decision zone. Below that, the next liquidity level sits near 4,564.602. If this level breaks cleanly, gold could continue toward the 4,520–4,525 area, where the chart marks the projected Elliott wave 5 completion and Fibonacci 1.618 target.
➤ Key levels
◌ Current price area: 4,598
◌ Reaction / decision zone: 4,579–4,585
◌ Liquidity support: 4,564.602
◌ Main bearish target: 4,520–4,525
◌ Extension target if selling accelerates: around 4,433
◌ Invalidation resistance: 4,630–4,640
⌁ Trading scenario
Entry: Sell on bearish rejection around 4,598–4,605, or after price drops back below 4,585 and retests it weakly.
Stop Loss: Above 4,640
Take Profit 1: 4,564.602
Take Profit 2: 4,520–4,525
Take Profit 3: around 4,433 if wave 5 extends further
This setup stays valid while gold remains capped below the recent lower-high area and fails to reclaim bullish momentum.
◌ Invalidation
If buyers push price back above 4,630–4,640 and hold there, the bearish wave count becomes weaker. In that case, the current downside scenario may be delayed or invalidated.
▸ Final view
Kelly’s main view remains bearish for now. The chart still supports a corrective bounce first, followed by another move lower toward liquidity and the projected wave 5 completion zone. As long as gold stays below the recent swing-high resistance, rallies are still more likely to be sold than chased higher.
Do you think gold will complete wave (5) first, or can buyers defend the structure and force a stronger recovery?

📌 New analysis published daily
🔔 Follow this profile for real-time updates
⚠️ This is personal analysis, not financial advice
Daily GOLD and Forex updates: t.me/+_8wydjUbci5hMzJl
🔔 Follow this profile for real-time updates
⚠️ This is personal analysis, not financial advice
Daily GOLD and Forex updates: t.me/+_8wydjUbci5hMzJl
Related publications
Disclaimer
The information and publications are not meant to be, and do not constitute, financial, investment, trading, or other types of advice or recommendations supplied or endorsed by TradingView. Read more in the Terms of Use.
📌 New analysis published daily
🔔 Follow this profile for real-time updates
⚠️ This is personal analysis, not financial advice
Daily GOLD and Forex updates: t.me/+_8wydjUbci5hMzJl
🔔 Follow this profile for real-time updates
⚠️ This is personal analysis, not financial advice
Daily GOLD and Forex updates: t.me/+_8wydjUbci5hMzJl
Related publications
Disclaimer
The information and publications are not meant to be, and do not constitute, financial, investment, trading, or other types of advice or recommendations supplied or endorsed by TradingView. Read more in the Terms of Use.