
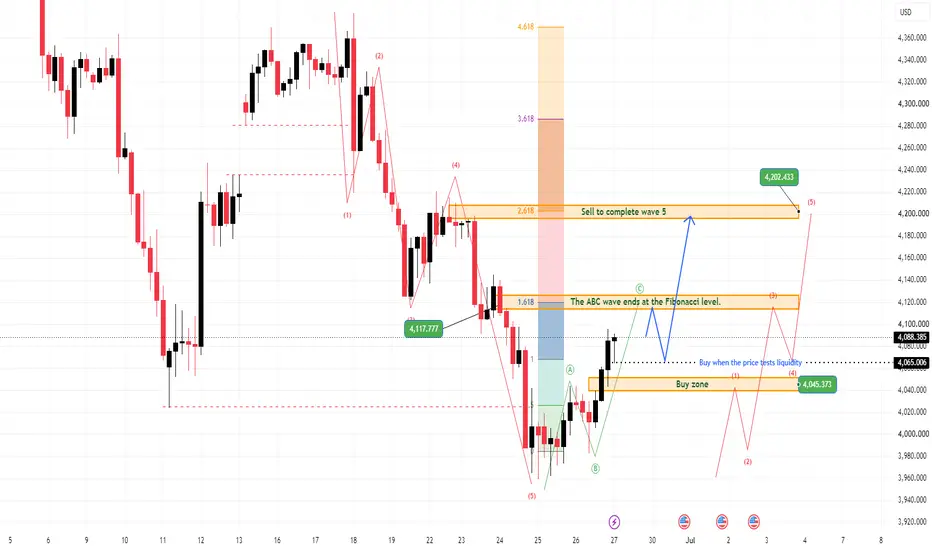
Gold is starting the new week with a corrective recovery structure after reacting from the lower liquidity area near 3,950–4,000. From Kelly’s view, the current move is developing as an Elliott ABC recovery, but the chart also leaves room for a stronger 5-wave upside scenario if buyers continue to defend the buy zone.
The key idea is simple: gold has already reacted from the lower base, and the next weekly direction depends on whether price can hold above the liquidity retest zone.
⟡ Market structure
The chart shows gold completed a strong bearish sequence into the lower area, then started forming a recovery from the buy zone around 4,045. Price is now trading near 4,083, above the first liquidity reaction level.
This recovery is still early, but the structure is improving. If gold holds above the 4,045–4,065 area, the market may continue building wave C towards the Fibonacci resistance zone around 4,117–4,125.
Above that, the larger resistance and liquidity zone sits around 4,200–4,202, where Fibonacci 2.618 aligns with the projected upside structure.
➤ Key levels
◌ 4,045–4,065: buy zone and liquidity retest area
◌ 4,083: current reaction area
◌ 4,117–4,125: ABC completion / Fibonacci resistance zone
◌ 4,200–4,202: major liquidity zone and Fibonacci 2.618 target
◌ Below 4,045: area where the recovery structure weakens
◌ Below 3,950: area where the bullish recovery setup loses quality
⌁ Elliott Wave view
From an Elliott Wave perspective, gold appears to be developing an ABC corrective recovery after the previous bearish wave 5 completed near the lower base.
Wave A started from the low and created the first recovery reaction. Wave B corrected back into the buy zone and held above the liquidity base. Wave C may now be developing towards the 4,117–4,125 Fibonacci resistance area.
If wave C ends around this zone and price starts rejecting, the ABC recovery may be complete.
However, there is also a second scenario. If gold breaks above 4,125 with strong acceptance, the recovery may no longer be only a simple ABC correction. In that case, price could develop into a 5-wave bullish sequence, with the next major target around 4,200–4,202 at the Fibonacci 2.618 liquidity zone.
▸ Trading scenario
Preferred scenario: wait for price to hold the 4,045–4,065 buy zone and continue the ABC recovery.
Entry zone: 4,045–4,065 if bullish confirmation appears
Stop loss: below the confirmed reaction low or below 4,030
Take profit 1: 4,117–4,125
Take profit 2: 4,160
Take profit 3: 4,200–4,202 if the move expands into 5 waves
Alternative scenario: if gold fails to hold above 4,045 and breaks below the buy zone, the ABC recovery weakens. In that case, price may return to the lower base and the bullish structure should be reassessed.
⌁ Kelly’s view
For Kelly, this is a weekly recovery setup, but it still needs confirmation. The ABC structure is active while price holds above the buy zone, and the first important target is the Fibonacci area around 4,117–4,125.
If buyers break through that resistance with strength, the chart may shift from a simple ABC rebound into a stronger 5-wave recovery towards 4,200–4,202.
Gold is recovering from the lower liquidity base. The ABC structure is valid for now, but a clean breakout may open the stronger 5-wave path.
Share your view below.
The key idea is simple: gold has already reacted from the lower base, and the next weekly direction depends on whether price can hold above the liquidity retest zone.
⟡ Market structure
The chart shows gold completed a strong bearish sequence into the lower area, then started forming a recovery from the buy zone around 4,045. Price is now trading near 4,083, above the first liquidity reaction level.
This recovery is still early, but the structure is improving. If gold holds above the 4,045–4,065 area, the market may continue building wave C towards the Fibonacci resistance zone around 4,117–4,125.
Above that, the larger resistance and liquidity zone sits around 4,200–4,202, where Fibonacci 2.618 aligns with the projected upside structure.
➤ Key levels
◌ 4,045–4,065: buy zone and liquidity retest area
◌ 4,083: current reaction area
◌ 4,117–4,125: ABC completion / Fibonacci resistance zone
◌ 4,200–4,202: major liquidity zone and Fibonacci 2.618 target
◌ Below 4,045: area where the recovery structure weakens
◌ Below 3,950: area where the bullish recovery setup loses quality
⌁ Elliott Wave view
From an Elliott Wave perspective, gold appears to be developing an ABC corrective recovery after the previous bearish wave 5 completed near the lower base.
Wave A started from the low and created the first recovery reaction. Wave B corrected back into the buy zone and held above the liquidity base. Wave C may now be developing towards the 4,117–4,125 Fibonacci resistance area.
If wave C ends around this zone and price starts rejecting, the ABC recovery may be complete.
However, there is also a second scenario. If gold breaks above 4,125 with strong acceptance, the recovery may no longer be only a simple ABC correction. In that case, price could develop into a 5-wave bullish sequence, with the next major target around 4,200–4,202 at the Fibonacci 2.618 liquidity zone.
▸ Trading scenario
Preferred scenario: wait for price to hold the 4,045–4,065 buy zone and continue the ABC recovery.
Entry zone: 4,045–4,065 if bullish confirmation appears
Stop loss: below the confirmed reaction low or below 4,030
Take profit 1: 4,117–4,125
Take profit 2: 4,160
Take profit 3: 4,200–4,202 if the move expands into 5 waves
Alternative scenario: if gold fails to hold above 4,045 and breaks below the buy zone, the ABC recovery weakens. In that case, price may return to the lower base and the bullish structure should be reassessed.
⌁ Kelly’s view
For Kelly, this is a weekly recovery setup, but it still needs confirmation. The ABC structure is active while price holds above the buy zone, and the first important target is the Fibonacci area around 4,117–4,125.
If buyers break through that resistance with strength, the chart may shift from a simple ABC rebound into a stronger 5-wave recovery towards 4,200–4,202.
Gold is recovering from the lower liquidity base. The ABC structure is valid for now, but a clean breakout may open the stronger 5-wave path.
Share your view below.
Trade active
Review of last week's gold

📌 New analysis published daily
🔔 Follow this profile for real-time updates
⚠️ This is personal analysis, not financial advice
Daily GOLD and Forex updates: t.me/+SOSI26CZOJ1mZDhl
🔔 Follow this profile for real-time updates
⚠️ This is personal analysis, not financial advice
Daily GOLD and Forex updates: t.me/+SOSI26CZOJ1mZDhl
Disclaimer
The information and publications are not meant to be, and do not constitute, financial, investment, trading, or other types of advice or recommendations supplied or endorsed by TradingView. Read more in the Terms of Use.
📌 New analysis published daily
🔔 Follow this profile for real-time updates
⚠️ This is personal analysis, not financial advice
Daily GOLD and Forex updates: t.me/+SOSI26CZOJ1mZDhl
🔔 Follow this profile for real-time updates
⚠️ This is personal analysis, not financial advice
Daily GOLD and Forex updates: t.me/+SOSI26CZOJ1mZDhl
Disclaimer
The information and publications are not meant to be, and do not constitute, financial, investment, trading, or other types of advice or recommendations supplied or endorsed by TradingView. Read more in the Terms of Use.