
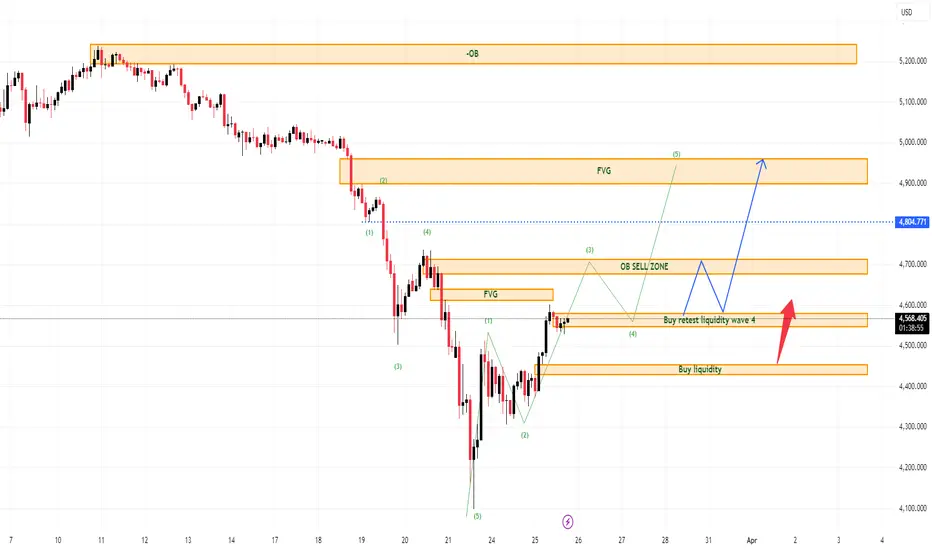
while the bigger impulsive leg has not started yet
Gold is continuing to recover from the recent low, but the current move is better read as a wave 2 rebound rather than a full bullish expansion.
That distinction matters, because wave 2 usually carries a corrective character: price can recover with decent momentum, but the move is still vulnerable until the next impulsive leg confirms itself.
For Kelly, this is an important stage.
The market is no longer collapsing, but it is not yet in the strongest part of the upside sequence either. What we are seeing now is a recovery structure trying to build a base before the next real decision point.
Technical structure
The sharp reaction from the lower buy liquidity zone around 4400–4420 created the first shift in short-term tone.
From there, gold established a recovery path with higher lows and started rotating back into the 4550–4560 retest liquidity area, which is now acting as the immediate support base for the current rebound.
This zone is important because it sits right under current price and represents the area buyers need to defend if the recovery is going to stay valid.
As long as gold continues to hold above this base, the corrective rebound in wave 2 remains intact.
Above the market, the next technical layers are clearly visible:
4690–4710 OB sell zone as the first major resistance
4900–4950 FVG as the next upside inefficiency area
5200 higher-timeframe OB as the larger medium-term reference if the recovery expands further
So structurally, price has room to continue higher in the short to medium term, but the market is still traveling through resistance overhead, which is why the current move should not yet be treated as a completed bullish reversal.
Wave count and market logic
From an Elliott-style view, the current recovery is more consistent with wave 2.
The reason is that the rebound is happening after a deep selloff and is now retracing back into prior imbalance and supply. That is typical wave 2 behavior:
price recovers from exhaustion, corrects part of the decline, and tests whether the market is ready to transition into a stronger leg later.
At this point, wave 2 can still continue stretching higher as long as price keeps respecting the recovery base.
That opens the way for a push toward the 4690–4710 OB zone, where the chart is more likely to face a meaningful decision.
Only after price proves it can move cleanly through those upper resistance layers would the case for a broader impulsive leg become stronger.
Until then, the current rebound should still be treated as a corrective build-up phase rather than a confirmed breakout sequence.
Why gold is still supported fundamentally
Gold is also not cooling off easily in the current environment.
War-related uncertainty and persistent inflation risk are both helping to keep the metal supported on dips.
That does not mean price can only move in one direction, but it does explain why the market is able to recover from liquidity zones instead of staying under heavy pressure for long.
In other words, the macro backdrop is helping the technical recovery stay alive while the chart builds through wave 2.
For Kelly, this combination matters.
When technical recovery aligns with a market environment that still favors defensive demand, the path of least resistance in the near term can remain to the upside — at least until the chart reaches stronger supply.
What matters next
The immediate focus is still on how gold behaves around the current 4550–4560 support-retest zone.
If price continues to hold there and prints another constructive push higher, then the next likely destination remains the 4690–4710 OB sell zone.
That is the first area where wave 2 may begin to slow down or meet heavier resistance.
If buyers manage to break above that zone with stronger follow-through, then the larger 4900–4950 FVG becomes the next technical magnet.
That would still fit the idea of wave 2 extending further before the market decides whether it is ready for the next major rotation.
On the downside, a loss of the current retest base would weaken the quality of the rebound and suggest that wave 2 is failing to mature properly.
But right now, the chart still favors continuation of the recovery phase rather than immediate rejection.
Kelly’s read
For Kelly, this is not a sell structure anymore, but it is also not yet the strongest bullish phase.
The better interpretation is that gold is in a corrective recovery wave, with price still trying to climb toward overhead inefficiencies and supply.
That means the chart deserves patience.
There is enough structure to respect the upside, but not enough yet to call it a full impulsive breakout.
As long as price holds above the current base, the market can continue working higher through wave 2.
The real test will come later, when gold reaches the OB sell zone and the upper FVG. That is where the next higher-timeframe decision will likely be made.
Conclusion
Gold is still in wave 2 recovery, and the current structure supports further upside as long as the 4550–4560 retest zone continues to hold.
The first major target remains the 4690–4710 OB zone, with room toward 4900–4950 if the rebound extends further.
For now, the market is not yet in wave 3 acceleration.
It is still building through the corrective phase — and that means the recovery can continue, but the strongest bullish leg has not started yet.
Gold is recovering with structure, but the real expansion still needs to be earned.
Gold is continuing to recover from the recent low, but the current move is better read as a wave 2 rebound rather than a full bullish expansion.
That distinction matters, because wave 2 usually carries a corrective character: price can recover with decent momentum, but the move is still vulnerable until the next impulsive leg confirms itself.
For Kelly, this is an important stage.
The market is no longer collapsing, but it is not yet in the strongest part of the upside sequence either. What we are seeing now is a recovery structure trying to build a base before the next real decision point.
Technical structure
The sharp reaction from the lower buy liquidity zone around 4400–4420 created the first shift in short-term tone.
From there, gold established a recovery path with higher lows and started rotating back into the 4550–4560 retest liquidity area, which is now acting as the immediate support base for the current rebound.
This zone is important because it sits right under current price and represents the area buyers need to defend if the recovery is going to stay valid.
As long as gold continues to hold above this base, the corrective rebound in wave 2 remains intact.
Above the market, the next technical layers are clearly visible:
4690–4710 OB sell zone as the first major resistance
4900–4950 FVG as the next upside inefficiency area
5200 higher-timeframe OB as the larger medium-term reference if the recovery expands further
So structurally, price has room to continue higher in the short to medium term, but the market is still traveling through resistance overhead, which is why the current move should not yet be treated as a completed bullish reversal.
Wave count and market logic
From an Elliott-style view, the current recovery is more consistent with wave 2.
The reason is that the rebound is happening after a deep selloff and is now retracing back into prior imbalance and supply. That is typical wave 2 behavior:
price recovers from exhaustion, corrects part of the decline, and tests whether the market is ready to transition into a stronger leg later.
At this point, wave 2 can still continue stretching higher as long as price keeps respecting the recovery base.
That opens the way for a push toward the 4690–4710 OB zone, where the chart is more likely to face a meaningful decision.
Only after price proves it can move cleanly through those upper resistance layers would the case for a broader impulsive leg become stronger.
Until then, the current rebound should still be treated as a corrective build-up phase rather than a confirmed breakout sequence.
Why gold is still supported fundamentally
Gold is also not cooling off easily in the current environment.
War-related uncertainty and persistent inflation risk are both helping to keep the metal supported on dips.
That does not mean price can only move in one direction, but it does explain why the market is able to recover from liquidity zones instead of staying under heavy pressure for long.
In other words, the macro backdrop is helping the technical recovery stay alive while the chart builds through wave 2.
For Kelly, this combination matters.
When technical recovery aligns with a market environment that still favors defensive demand, the path of least resistance in the near term can remain to the upside — at least until the chart reaches stronger supply.
What matters next
The immediate focus is still on how gold behaves around the current 4550–4560 support-retest zone.
If price continues to hold there and prints another constructive push higher, then the next likely destination remains the 4690–4710 OB sell zone.
That is the first area where wave 2 may begin to slow down or meet heavier resistance.
If buyers manage to break above that zone with stronger follow-through, then the larger 4900–4950 FVG becomes the next technical magnet.
That would still fit the idea of wave 2 extending further before the market decides whether it is ready for the next major rotation.
On the downside, a loss of the current retest base would weaken the quality of the rebound and suggest that wave 2 is failing to mature properly.
But right now, the chart still favors continuation of the recovery phase rather than immediate rejection.
Kelly’s read
For Kelly, this is not a sell structure anymore, but it is also not yet the strongest bullish phase.
The better interpretation is that gold is in a corrective recovery wave, with price still trying to climb toward overhead inefficiencies and supply.
That means the chart deserves patience.
There is enough structure to respect the upside, but not enough yet to call it a full impulsive breakout.
As long as price holds above the current base, the market can continue working higher through wave 2.
The real test will come later, when gold reaches the OB sell zone and the upper FVG. That is where the next higher-timeframe decision will likely be made.
Conclusion
Gold is still in wave 2 recovery, and the current structure supports further upside as long as the 4550–4560 retest zone continues to hold.
The first major target remains the 4690–4710 OB zone, with room toward 4900–4950 if the rebound extends further.
For now, the market is not yet in wave 3 acceleration.
It is still building through the corrective phase — and that means the recovery can continue, but the strongest bullish leg has not started yet.
Gold is recovering with structure, but the real expansion still needs to be earned.

📌 New analysis published daily
🔔 Follow this profile for real-time updates
⚠️ This is personal analysis, not financial advice
Daily GOLD and Forex updates: t.me/+_8wydjUbci5hMzJl
🔔 Follow this profile for real-time updates
⚠️ This is personal analysis, not financial advice
Daily GOLD and Forex updates: t.me/+_8wydjUbci5hMzJl
Related publications
Disclaimer
The information and publications are not meant to be, and do not constitute, financial, investment, trading, or other types of advice or recommendations supplied or endorsed by TradingView. Read more in the Terms of Use.
📌 New analysis published daily
🔔 Follow this profile for real-time updates
⚠️ This is personal analysis, not financial advice
Daily GOLD and Forex updates: t.me/+_8wydjUbci5hMzJl
🔔 Follow this profile for real-time updates
⚠️ This is personal analysis, not financial advice
Daily GOLD and Forex updates: t.me/+_8wydjUbci5hMzJl
Related publications
Disclaimer
The information and publications are not meant to be, and do not constitute, financial, investment, trading, or other types of advice or recommendations supplied or endorsed by TradingView. Read more in the Terms of Use.