
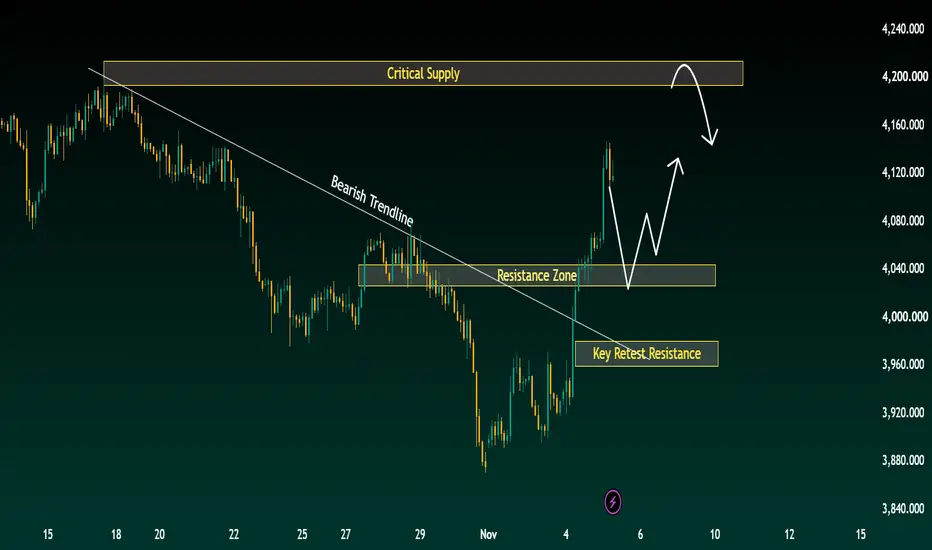
Gold has broken through descending resistance and accelerated toward 4,140. The next test is whether a pullback can preserve that progress before buyers challenge critical supply.
The H2 chart now shows a materially stronger recovery. Price has cleared both the 3,960–3,980 retest zone and the higher 4,025–4,045 resistance band.
The earlier scenario of an immediate rejection beneath those barriers has been overtaken by the breakout. Attention now shifts to the quality of the next correction.
Wave Context — Strong Expansion, Count Still Provisional
The advance from the late-October low has developed into a forceful upward leg. Its speed and range suggest stronger buying pressure, but they do not independently confirm a completed Elliott Wave impulse.
Two interpretations remain open: a developing bullish sequence, or an extended corrective rally within the larger decline.
The next pullback can help distinguish them. A controlled retracement that holds reclaimed support and produces another advance would strengthen the bullish interpretation. A rapid loss of those zones would weaken it.
The chart does not display sufficient internal wave labels to assign a confirmed wave number.
Key Zones — Where the Recovery Will Be Tested
• Around 4,140–4,150: The latest expansion high visible on the chart. This is the first upside reference after a successful pullback.
• 4,025–4,045: Former resistance and the main projected retest area. A bullish reaction here would support the resistance-to-support transition.
• 3,960–3,980: The lower reclaimed zone. A return here would indicate a deeper correction and weaken the immediate continuation setup.
• 4,195–4,215: Critical overhead supply. This remains a conditional upside objective, not a guaranteed destination.
All boundaries are approximate readings from the supplied chart.
Primary Scenario — Pullback, Hold, Then Another Advance
The main projected path allows price to retrace toward 4,025–4,045 before attempting another upward leg.
Touching this zone alone would not confirm that the correction is complete. Buyers would need to defend it, establish a recovery from the pullback, and break the intervening reaction high.
If that sequence develops, the recent 4,140–4,150 area becomes the first upside reference.
Sustained acceptance above the recent high would bring 4,195–4,215 into focus. A direct extension without a deep retest is also possible; the projected pullback is one potential route rather than a required sequence.
At critical supply, the chart anticipates possible rejection. That reaction would need confirmation before treating the rally as exhausted.
Alternative Scenario — The Retest Fails
An H2 close below approximately 4,025, followed by a failed reclaim, would invalidate the immediate continuation setup based on the upper support band.
Attention would then shift toward 3,960–3,980.
Holding that lower zone could still preserve a broader recovery, although the correction would be deeper than the preferred path. Sustained acceptance beneath 3,960 would undermine the breakout structure further and require a fresh wave assessment.
These are scenario invalidation conditions, not formal Elliott Wave invalidation levels for a confirmed count.
Fibonacci Perspective — Let the Swing Define the Measurement
No Fibonacci retracement or extension tool is plotted on this chart. The highlighted zones should therefore remain price references rather than claimed Fibonacci confluences.
Once the current upward leg establishes a clear endpoint, its retracement can be measured against the relevant swing low. Extension targets require a confirmed corrective pivot as well.
For now, the key evidence is whether the pullback preserves reclaimed support and leads to renewed expansion.
The Bigger Picture
A softer dollar and easing Treasury yields supported gold on Thursday, while Friday’s U.S. payrolls report remains a key catalyst.
That backdrop supports the recovery narrative, but the chart still needs to demonstrate that buyers can defend their gains.
The breakout changed the outlook. The next pullback will test its durability.
Would a defended retest of 4,025–4,045 strengthen your bullish wave interpretation, or would you wait for a new high?
The H2 chart now shows a materially stronger recovery. Price has cleared both the 3,960–3,980 retest zone and the higher 4,025–4,045 resistance band.
The earlier scenario of an immediate rejection beneath those barriers has been overtaken by the breakout. Attention now shifts to the quality of the next correction.
Wave Context — Strong Expansion, Count Still Provisional
The advance from the late-October low has developed into a forceful upward leg. Its speed and range suggest stronger buying pressure, but they do not independently confirm a completed Elliott Wave impulse.
Two interpretations remain open: a developing bullish sequence, or an extended corrective rally within the larger decline.
The next pullback can help distinguish them. A controlled retracement that holds reclaimed support and produces another advance would strengthen the bullish interpretation. A rapid loss of those zones would weaken it.
The chart does not display sufficient internal wave labels to assign a confirmed wave number.
Key Zones — Where the Recovery Will Be Tested
• Around 4,140–4,150: The latest expansion high visible on the chart. This is the first upside reference after a successful pullback.
• 4,025–4,045: Former resistance and the main projected retest area. A bullish reaction here would support the resistance-to-support transition.
• 3,960–3,980: The lower reclaimed zone. A return here would indicate a deeper correction and weaken the immediate continuation setup.
• 4,195–4,215: Critical overhead supply. This remains a conditional upside objective, not a guaranteed destination.
All boundaries are approximate readings from the supplied chart.
Primary Scenario — Pullback, Hold, Then Another Advance
The main projected path allows price to retrace toward 4,025–4,045 before attempting another upward leg.
Touching this zone alone would not confirm that the correction is complete. Buyers would need to defend it, establish a recovery from the pullback, and break the intervening reaction high.
If that sequence develops, the recent 4,140–4,150 area becomes the first upside reference.
Sustained acceptance above the recent high would bring 4,195–4,215 into focus. A direct extension without a deep retest is also possible; the projected pullback is one potential route rather than a required sequence.
At critical supply, the chart anticipates possible rejection. That reaction would need confirmation before treating the rally as exhausted.
Alternative Scenario — The Retest Fails
An H2 close below approximately 4,025, followed by a failed reclaim, would invalidate the immediate continuation setup based on the upper support band.
Attention would then shift toward 3,960–3,980.
Holding that lower zone could still preserve a broader recovery, although the correction would be deeper than the preferred path. Sustained acceptance beneath 3,960 would undermine the breakout structure further and require a fresh wave assessment.
These are scenario invalidation conditions, not formal Elliott Wave invalidation levels for a confirmed count.
Fibonacci Perspective — Let the Swing Define the Measurement
No Fibonacci retracement or extension tool is plotted on this chart. The highlighted zones should therefore remain price references rather than claimed Fibonacci confluences.
Once the current upward leg establishes a clear endpoint, its retracement can be measured against the relevant swing low. Extension targets require a confirmed corrective pivot as well.
For now, the key evidence is whether the pullback preserves reclaimed support and leads to renewed expansion.
The Bigger Picture
A softer dollar and easing Treasury yields supported gold on Thursday, while Friday’s U.S. payrolls report remains a key catalyst.
That backdrop supports the recovery narrative, but the chart still needs to demonstrate that buyers can defend their gains.
The breakout changed the outlook. The next pullback will test its durability.
Would a defended retest of 4,025–4,045 strengthen your bullish wave interpretation, or would you wait for a new high?
Trade closed manually
Gold's recent rally from the 3,880 area extended toward 4,140 before encountering selling pressure. The subsequent correction brought price back toward the 4,030–4,045 resistance-turned-support zone, broadly aligning with the anticipated pullback.
This trading plan is now officially Closed Manually.
The next key observation is whether buyers can defend the current support area and rebuild momentum toward 4,080–4,140.
A sustained break below 4,030 could instead expose the 3,960–3,975 retest zone.
The plan ends here, while the broader market structure remains under observation.

Related publications
Disclaimer
The information and publications are not meant to be, and do not constitute, financial, investment, trading, or other types of advice or recommendations supplied or endorsed by TradingView. Read more in the Terms of Use.
Related publications
Disclaimer
The information and publications are not meant to be, and do not constitute, financial, investment, trading, or other types of advice or recommendations supplied or endorsed by TradingView. Read more in the Terms of Use.