
Gold has found buyers near the lows again.
But finding buyers and starting a new bullish trend are two completely different things.
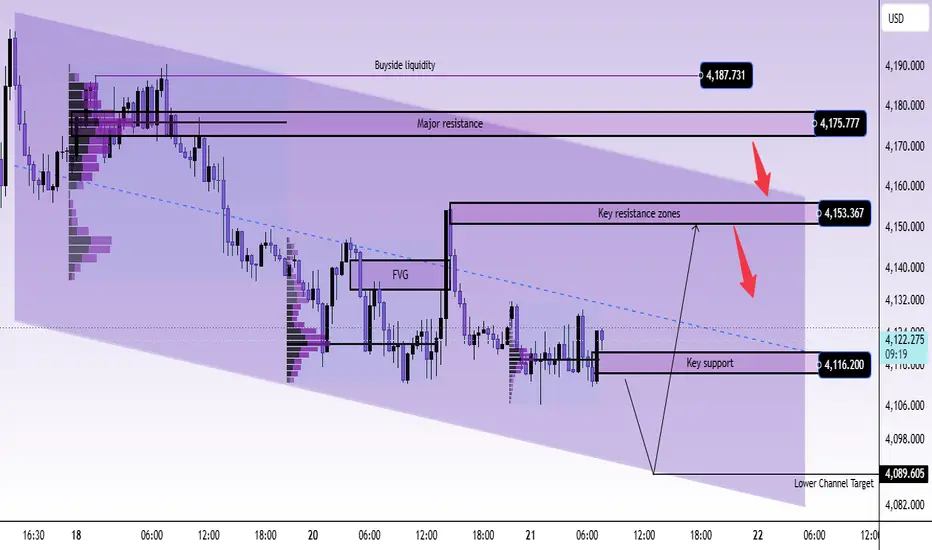
After another failed recovery towards 4,190, gold has returned to the lower portion of its descending channel, with price currently trading around 4,121.
The immediate support at 4,116 is still being tested.
And although buyers are trying to stabilise the market, the larger price structure continues to favour sellers.
Here's what concerns me.
Gold has declined in five of the previous seven months, and the current month has yet to produce a convincing recovery in price.
The market still finds buying interest around major lows, particularly near the psychological 4,000 level.
But those reactions have not been strong enough to restore the previous bullish trend.
That distinction matters.
Buyers can defend support without controlling the market.
And right now, the chart suggests exactly that.
My main view remains bearish below 4,153, with 4,116 acting as the immediate decision point.
If that support breaks, 4,104 and the lower channel near 4,089 become the next areas I want to watch.
WHY GOLD'S RECOVERY KEEPS FAILING
Let's look at the bigger picture before focusing on the next trade.
Gold previously experienced a strong bullish recovery after taking sell-side liquidity around 4,075–4,090.
That reaction initially looked promising.
Buyers regained several short-term resistance levels and eventually pushed the market towards 4,190–4,200.
But every attempt to establish sustained acceptance above the upper supply failed.
Instead of building stronger higher highs, price began producing lower highs.
The market gradually lost its recovery structure.
And once 4,150–4,160 broke, sellers regained the advantage.
The important point is that the market has not simply fallen because of one negative news event.
It has repeatedly failed to maintain higher prices.
From an ICT perspective, the earlier sell-side liquidity sweep provided fuel for a corrective recovery.
However, the failure to establish a convincing bullish structural break suggests that the recovery may have been a temporary repricing phase within a larger bearish environment.
Now price has returned to the lower trading range.
And buyers are once again being tested.
THE DESCENDING CHANNEL IS STILL IN CONTROL
The clearest technical feature on this chart is the descending channel.
Gold continues to form lower highs while moving between a declining resistance boundary and a declining support boundary.
The channel has remained relevant throughout the recent sessions.
Every attempt to recover has struggled to establish sustained momentum beyond its internal resistance.
At the same time, the lower boundary continues to attract attention during bearish extensions.
This gives us a structured trading environment.
But I don't treat a channel as a prediction that price must move in a straight line.
A bearish channel can contain several bullish recoveries.
Some may be strong enough to attract breakout buyers.
Others may briefly interrupt the decline.
What matters is whether the recovery changes the larger sequence of highs and lows.
Right now, gold remains beneath the descending resistance structure.
The current rebound around 4,116–4,124 is not enough to demonstrate a meaningful bullish reversal.
Until buyers reclaim the important overhead supply, I continue treating upward movement as a potential correction.
And that keeps my focus on selling confirmed weakness after a recovery rather than chasing every fresh low.
4116 — THE SUPPORT EVERYONE IS WATCHING
The immediate decision point is 4,116.200.
Look closely at the latest candles.
Gold has repeatedly moved around this level, with buyers attempting to defend the area and prevent another downside expansion.
The current price is slightly above support.
That tells me the level is still attracting participation.
But it doesn't tell me that buyers have regained control.
There's an important difference.
If gold breaks beneath 4,116 and immediately reclaims it with strong bullish displacement, we could be looking at another sell-side liquidity sweep.
That could produce a corrective move back towards the descending channel midpoint.
However, if price breaks 4,116, retests the level from below and fails to recover, the bearish continuation scenario becomes stronger.
At that point, 4,104 becomes the next downside checkpoint.
And if selling pressure remains intact, the lower channel around 4,089.605 comes into focus.
This is why I don't want to sell the first candle that breaks support.
A liquidity sweep can look exactly like a breakdown during its initial stage.
The follow-through is what separates them.
VOLUME PROFILE — THE MARKET IS ACCEPTING LOWER PRICES
Now look at the volume distributions.
Earlier trading activity was concentrated around the higher 4,170–4,185 region.
That was where buyers and sellers exchanged positions during the previous recovery attempt.
But as gold declined, the newer trading distributions developed at progressively lower levels.
The most recent activity is concentrated near 4,115–4,125.
This tells us something important about the recent trading range.
The market is spending more time below the areas where it previously attempted to establish a recovery.
From a Volume Profile perspective, that is consistent with downward repricing.
But volume concentration alone does not prove institutional selling.
It identifies where trading activity occurred.
What gives the information meaning is how price behaves around that activity.
If gold continues trading below the previous higher-volume regions, the bearish structure remains relevant.
If buyers reclaim those areas and begin maintaining higher prices, the balance could change.
For now, the distribution of trading activity is consistent with the descending price structure.
And neither is providing convincing evidence of a sustainable bullish breakout.
THE FVG COULD BECOME THE NEXT SELLER'S OPPORTUNITY
There's one area above the current price I don't want to ignore.
4,134–4,143.
This is where the bearish Fair Value Gap remains relevant.
After a strong directional move, price may revisit an imbalance as the market attempts to rebalance previous inefficient trading.
That does not mean the FVG must reject price.
But it gives us a location to examine the next recovery.
Imagine gold defends 4,116 and begins pushing higher.
Price moves through 4,125 and gradually approaches 4,134.
Momentum traders start believing that buyers are recovering.
Then gold enters the FVG.
The candles become weaker.
A local high gets swept.
And the market begins producing bearish displacement.
That would be an interesting sequence.
Not because an FVG is automatically a selling signal.
But because a failed recovery into an imbalance, followed by a bearish market structure shift, provides stronger evidence that sellers are defending the existing trend.
If that reaction occurs, 4,116 becomes the first downside focus again.
Below it, 4,104 and 4,089 remain the next important destinations.
But if buyers establish acceptance above 4,143, the next resistance to evaluate is 4,150–4,153.
That is where the larger structural test begins.
4153 — THE LEVEL SELLERS NEED TO DEFEND
The chart marks 4,153.367 as a critical overhead reference.
I consider the 4,150–4,153 area the primary short-term resistance zone.
Why?
Because it represents a previous recovery rejection area, sits above the current bearish FVG and approaches the projected upper channel boundary.
That's meaningful confluence.
If gold stages a stronger recovery towards this region, I would be watching for renewed selling pressure.
A failed reclaim, followed by bearish displacement and a lower-timeframe structure shift, would support another move towards the lower channel.
But I would not sell simply because price reaches 4,153.
I want the market to demonstrate that supply is still active.
And there is a clear condition that would weaken my bearish view.
If gold breaks above 4,153, successfully retests the area and sustains trading above the descending channel, short-term sellers would begin losing their structural advantage.
In that case, the next important overhead region becomes 4,175.777.
Beyond it, buy-side liquidity around 4,187.731 remains a significant higher reference.
A sustained reclaim of 4,175–4,188 would require me to reconsider the current bearish thesis.
THE LOWER CHANNEL — 4089 COULD BE MORE IMPORTANT THAN IT LOOKS
The chart projects the lower channel boundary near 4,089.605.
This is one of the areas I find most interesting for the next potential liquidity event.
If gold loses 4,116 and continues beneath 4,104, the market could approach the lower boundary of the descending channel.
But the timing matters.
A descending channel is dynamic, so its lower boundary changes as time progresses.
I would use 4,089 as an approximate projected reaction level, not a permanently fixed support.
There are two possible outcomes.
First, gold reaches the lower channel, sweeps nearby sell-side liquidity and fails to sustain lower prices.
If buyers quickly reclaim the boundary and produce bullish displacement, a corrective recovery could develop.
That might initially bring price back towards 4,116–4,125.
A stronger bounce could later test the FVG.
Second, gold reaches the channel floor and fails to attract meaningful demand.
If price breaks beneath the boundary and cannot reclaim it, the market may be entering a stronger bearish expansion.
Under those conditions, the previous lows around 4,075–4,085 become relevant again.
That is why I'm not treating the channel floor as an automatic buy.
It's a place to observe whether the sellers are losing momentum.
THE BIGGER QUESTION — IS 4000 REALLY A FLOOR?
This is where the broader market context becomes important.
Gold has struggled to establish a sustainable recovery despite repeated buying interest at lower prices.
The psychological 4,000 level has attracted buyers during previous declines.
But a major psychological support is not the same thing as a confirmed long-term bottom.
To establish a meaningful reversal, buyers need more than one strong reaction from the lows.
They need to create higher structural lows.
They need to reclaim broken resistance.
And they need to maintain acceptance at progressively higher prices.
So far, that sequence remains incomplete.
There's also an important distinction between price weakness and the complete disappearance of gold demand.
Investment flows, physical demand and short-term speculative positioning can move in different directions.
Gold may continue attracting longer-term investors even while the trading structure remains bearish.
For my current analysis, the chart provides the more immediate directional evidence.
And the chart still shows sellers defending lower highs.
I would not treat 4,000 as an immediate target from today's intraday setup.
It is a broader psychological support area that becomes relevant only if the market breaks through several intermediate structures and continues weakening.
THE MACRO PRESSURE HAS NOT DISAPPEARED
Gold also faces a difficult fundamental environment.
Expectations surrounding the Federal Reserve's future interest-rate path remain an important influence.
The market may expect the Fed to hold rates during the October meeting, but the possibility of further tightening later in the year has not disappeared.
Persistent inflation and higher energy prices could reinforce that concern.
Higher interest-rate expectations can reduce the relative attractiveness of non-yielding assets such as gold.
Meanwhile, geopolitical tensions in the Middle East may create demand for defensive assets.
But the same tensions can also push oil prices higher, adding to inflation concerns.
That creates competing forces.
Geopolitical uncertainty may support gold.
Higher inflation expectations and restrictive monetary policy may pressure it.
Even a weaker US Dollar does not guarantee an immediate bullish recovery.
The price structure still has to confirm that buyers are taking control.
Right now, that confirmation is missing.
ETHAN'S TRADING MAP
Current Price Reference: 4,121.065
Immediate Decision Zone: 4,116–4,125
Gold is consolidating around this area. A sustained break below 4,116 would increase bearish continuation risk.
First Recovery / FVG: 4,134–4,143
The first significant upside reaction area. Watch for a bearish rejection or sustained bullish reclaim.
Main Sell Reaction Zone: 4,150–4,153
Important overhead resistance and a potential area for sellers to defend the descending structure.
Higher Resistance: 4,175.777
A major structural obstacle. Reclaiming it would weaken the short-term bearish outlook.
Buy-Side Liquidity: 4,187.731
A higher liquidity reference that becomes relevant if a stronger recovery develops.
First Downside Checkpoint: 4,104
An intermediate support reference following a confirmed breakdown below 4,116.
Lower Channel Target: 4,089.605
A projected dynamic support and possible liquidity reaction area.
Extended Downside Reference: 4,075–4,085
The previous liquidity lows, relevant if price breaks the channel floor with sustained pressure.
Broader Psychological Support: 4,000
A higher-timeframe reference, not an immediate target on the current chart.
Bearish Confirmation:
A failed recovery into the FVG or 4,153 resistance, followed by bearish displacement and a lower-timeframe market structure shift.
Alternatively, a sustained breakdown below 4,116 followed by an unsuccessful retest.
Immediate Bearish Warning:
A successful reclaim of 4,153 and the descending channel resistance.
Stronger Bearish Invalidation:
Sustained acceptance above 4,175–4,188, accompanied by a confirmed bullish structural shift.
MY PREFERRED SCENARIO
I still favour bearish continuation, but I would prefer confirmation rather than an aggressive entry at current support.
The cleaner bearish setup would develop if gold recovered towards 4,134–4,143 or 4,150–4,153 and then failed to maintain higher prices.
If that happens, I would begin watching for renewed downside pressure towards 4,116.
A confirmed breakdown beneath 4,116 brings 4,104 into focus.
Below that, 4,089 becomes the next major projected channel target.
However, the market may also choose to sweep lower liquidity before recovering.
If gold drops into the lower channel, fails to continue down and produces bullish displacement, a corrective bounce becomes possible.
That would not automatically change the broader bearish structure.
For a meaningful bullish reversal, buyers must recover the broken resistance and establish stronger higher lows.
The structure must change.
Not just the colour of the candles.
ETHAN'S FINAL VIEW
Gold has spent several sessions trying to find a convincing bottom.
But the market continues showing lower highs, weaker recoveries and declining trading ranges.
That is not the structure of a strong bullish reversal.
It's the structure of a market where sellers still have the advantage.
The descending channel remains intact.
The important resistance at 4,153 has not been reclaimed.
And price is still hovering around the 4,116 support.
My primary view remains bearish while those conditions persist.
But I won't confuse bearish structure with the need to sell every decline.
If the market is approaching liquidity near the lower channel, I want to see how it reacts.
If gold recovers into resistance, I want to see whether sellers defend it.
If buyers reclaim the upper structure, I will reassess the bearish view.
For now, the market has three levels that matter most.
4,153 tells me whether sellers are still defending the recovery.
4,116 tells me whether the immediate support is about to fail.
4,089 is where the next important liquidity reaction could develop.
And the broader 4,000 area remains a psychological reference, not proof that the larger downtrend has ended.
Gold may find buyers at the lows.
But until buyers begin winning at resistance, the bearish structure remains the more convincing story.
Will gold lose 4,116 and test the lower channel around 4,089, or will another sell-side sweep create the recovery buyers have been waiting for?

🏆 Free Gold Plan: 1 - 3 signals per day
🏆 Vip Gold Scalping: 10 - 15 signals per day
🏆 Vip Gold Swing Trade: 3 - 5 signals per day
🏆 Trading Idea / Setup / Tech
Join here: t.me/+sihotWstAs8wZWVl
🏆 Vip Gold Scalping: 10 - 15 signals per day
🏆 Vip Gold Swing Trade: 3 - 5 signals per day
🏆 Trading Idea / Setup / Tech
Join here: t.me/+sihotWstAs8wZWVl
Related publications
Disclaimer
The information and publications are not meant to be, and do not constitute, financial, investment, trading, or other types of advice or recommendations supplied or endorsed by TradingView. Read more in the Terms of Use.
🏆 Free Gold Plan: 1 - 3 signals per day
🏆 Vip Gold Scalping: 10 - 15 signals per day
🏆 Vip Gold Swing Trade: 3 - 5 signals per day
🏆 Trading Idea / Setup / Tech
Join here: t.me/+sihotWstAs8wZWVl
🏆 Vip Gold Scalping: 10 - 15 signals per day
🏆 Vip Gold Swing Trade: 3 - 5 signals per day
🏆 Trading Idea / Setup / Tech
Join here: t.me/+sihotWstAs8wZWVl
Related publications
Disclaimer
The information and publications are not meant to be, and do not constitute, financial, investment, trading, or other types of advice or recommendations supplied or endorsed by TradingView. Read more in the Terms of Use.