
XAUUSD · Price Action · Bearish Market Structure
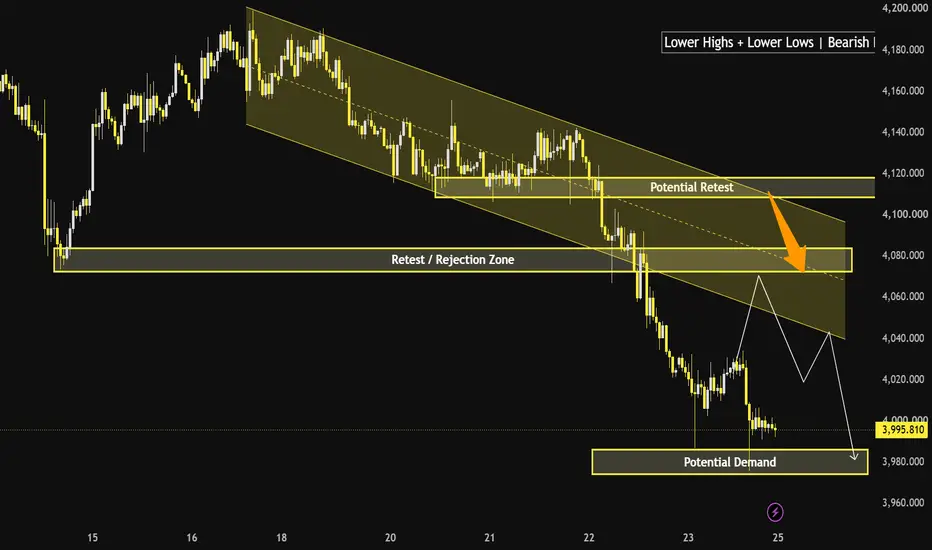
The latest chart continues to reinforce Elian Trade’s bearish outlook. After losing the $4,080 support zone, gold has broken below the psychological $4,000 level. However, price is now approaching a potential demand zone, shifting the focus toward the market’s reaction at support and whether the next rebound forms another lower high.
1. Latest XAUUSD Market News — October 24, 2026
Gold Falls to a Three-Month Low
According to Reuters on October 23, spot gold fell to an intraday low of $3,975.23/oz and declined approximately 4% for the week, heading toward its steepest weekly loss since June.
Source: Reuters
Rising Oil Prices Increase Inflation Risks
Reuters reported that Brent crude reached its highest level in more than five months following attacks in Saudi Arabia, raising concerns about potential energy supply disruptions. Renewed inflationary pressure could make the monetary policy outlook less favorable for gold.
Source: Reuters
Markets Focus on the October 27–28 Fed Meeting
Reuters reported that market pricing implied approximately a 92% probability of the Federal Reserve holding rates steady at its October meeting, while the probability of a December rate hike stood at around 78% at the time of reporting. The US PCE inflation report scheduled for October 29 will also be closely monitored.
Source: Reuters
The latest verified news primarily comes from Friday, October 23, as October 24 falls on a Saturday. These developments provide context for the chart captured at 01:03 UTC on October 24; they should not be interpreted as live market prices.
2. Price Action & Market Structure Analysis
CHART PRICE · October 24, 2026 · 01:03 UTC
3,995.810
Price displayed on the TradingView chart.
Key Price Zones
4,107–4,117: Potential retest and higher resistance zone.
4,073–4,083: Retest and potential rejection zone.
3,995.810: Reference price displayed on the chart.
3,973–3,985: Potential demand and lower support zone.
These price zones are approximate readings from the rectangles marked on the chart, not precise entry or target levels.
Market Structure — Lower Highs and Lower Lows Dominate
The chart continues to show a clear sequence of lower highs (LH) and lower lows (LL) within a descending price channel.
Price has broken below both the 4,107–4,117 and 4,073–4,083 support zones.
The upper boundary of the descending channel continues to pressure recovery attempts.
Price is consolidating briefly below $4,000, while the 3,973–3,985 potential demand zone remains an important area to monitor.
The projected white path suggests the possibility of one or more rebounds forming lower highs before the market resumes its downward move.
Bearish Scenario — Recovery Into Resistance
A recovery toward 4,073–4,083 could provide an opportunity to assess whether the previously broken support zone has turned into resistance.
If the rebound extends further, 4,107–4,117 near the descending channel becomes the more significant structural test.
If buyers fail at these resistance zones and another lower high develops, a retest of the 3,973–3,985 demand area remains a plausible scenario.
Bullish Scenario — Confirmation Required
A bounce from below $4,000 does not automatically signal the end of the downtrend.
Buyers need to establish a higher low and subsequently break an important swing high. If price reclaims 4,107–4,117 and holds above the descending resistance trendline, the bearish outlook would weaken significantly.
Central Insight: Gold can rebound without reversing. The next lower high may be the more important signal.
Additional Economic Data
US consumer sentiment came in at 48.0 in October, compared with 48.1 in the previous month. One-year inflation expectations increased to 4.7%, keeping the interest-rate outlook in focus for gold traders.
Source: Reuters
3. TradingView Post — English
Three Hook Titles (Under 60 Characters)
01. XAUUSD: A Bounce or Just Another Lower High?
02. Gold Breaks $4,000 — Is a Retest Next?
03. Gold's Bearish Channel Faces a Demand Test
Recommended Hook: Gold Breaks $4,000 — Is a Retest Next?
This headline highlights a clear price-action event while raising a key question about the next potential retest zone.
The latest chart continues to reinforce Elian Trade’s bearish outlook. After losing the $4,080 support zone, gold has broken below the psychological $4,000 level. However, price is now approaching a potential demand zone, shifting the focus toward the market’s reaction at support and whether the next rebound forms another lower high.
1. Latest XAUUSD Market News — October 24, 2026
Gold Falls to a Three-Month Low
According to Reuters on October 23, spot gold fell to an intraday low of $3,975.23/oz and declined approximately 4% for the week, heading toward its steepest weekly loss since June.
Source: Reuters
Rising Oil Prices Increase Inflation Risks
Reuters reported that Brent crude reached its highest level in more than five months following attacks in Saudi Arabia, raising concerns about potential energy supply disruptions. Renewed inflationary pressure could make the monetary policy outlook less favorable for gold.
Source: Reuters
Markets Focus on the October 27–28 Fed Meeting
Reuters reported that market pricing implied approximately a 92% probability of the Federal Reserve holding rates steady at its October meeting, while the probability of a December rate hike stood at around 78% at the time of reporting. The US PCE inflation report scheduled for October 29 will also be closely monitored.
Source: Reuters
The latest verified news primarily comes from Friday, October 23, as October 24 falls on a Saturday. These developments provide context for the chart captured at 01:03 UTC on October 24; they should not be interpreted as live market prices.
2. Price Action & Market Structure Analysis
CHART PRICE · October 24, 2026 · 01:03 UTC
3,995.810
Price displayed on the TradingView chart.
Key Price Zones
4,107–4,117: Potential retest and higher resistance zone.
4,073–4,083: Retest and potential rejection zone.
3,995.810: Reference price displayed on the chart.
3,973–3,985: Potential demand and lower support zone.
These price zones are approximate readings from the rectangles marked on the chart, not precise entry or target levels.
Market Structure — Lower Highs and Lower Lows Dominate
The chart continues to show a clear sequence of lower highs (LH) and lower lows (LL) within a descending price channel.
Price has broken below both the 4,107–4,117 and 4,073–4,083 support zones.
The upper boundary of the descending channel continues to pressure recovery attempts.
Price is consolidating briefly below $4,000, while the 3,973–3,985 potential demand zone remains an important area to monitor.
The projected white path suggests the possibility of one or more rebounds forming lower highs before the market resumes its downward move.
Bearish Scenario — Recovery Into Resistance
A recovery toward 4,073–4,083 could provide an opportunity to assess whether the previously broken support zone has turned into resistance.
If the rebound extends further, 4,107–4,117 near the descending channel becomes the more significant structural test.
If buyers fail at these resistance zones and another lower high develops, a retest of the 3,973–3,985 demand area remains a plausible scenario.
Bullish Scenario — Confirmation Required
A bounce from below $4,000 does not automatically signal the end of the downtrend.
Buyers need to establish a higher low and subsequently break an important swing high. If price reclaims 4,107–4,117 and holds above the descending resistance trendline, the bearish outlook would weaken significantly.
Central Insight: Gold can rebound without reversing. The next lower high may be the more important signal.
Additional Economic Data
US consumer sentiment came in at 48.0 in October, compared with 48.1 in the previous month. One-year inflation expectations increased to 4.7%, keeping the interest-rate outlook in focus for gold traders.
Source: Reuters
3. TradingView Post — English
Three Hook Titles (Under 60 Characters)
01. XAUUSD: A Bounce or Just Another Lower High?
02. Gold Breaks $4,000 — Is a Retest Next?
03. Gold's Bearish Channel Faces a Demand Test
Recommended Hook: Gold Breaks $4,000 — Is a Retest Next?
This headline highlights a clear price-action event while raising a key question about the next potential retest zone.
Trade closed manually
XAUUSD — Closed Manually | Plan Concluded
Gold's recovery tested the first resistance area near 4,024–4,035 but failed to sustain a breakout, leaving the broader bearish structure intact.
Price subsequently declined toward the marked 3,973–3,985 demand zone before staging another short-term rebound, broadly reflecting the original bearish outlook.
Looking ahead, reclaiming 4,024–4,035 could support further recovery, while renewed rejection would keep sellers in control. A confirmed breakdown below demand would reinforce bearish continuation.
The original plan is now closed manually. Further price action will be assessed separately.

Related publications
Disclaimer
The information and publications are not meant to be, and do not constitute, financial, investment, trading, or other types of advice or recommendations supplied or endorsed by TradingView. Read more in the Terms of Use.
Related publications
Disclaimer
The information and publications are not meant to be, and do not constitute, financial, investment, trading, or other types of advice or recommendations supplied or endorsed by TradingView. Read more in the Terms of Use.