
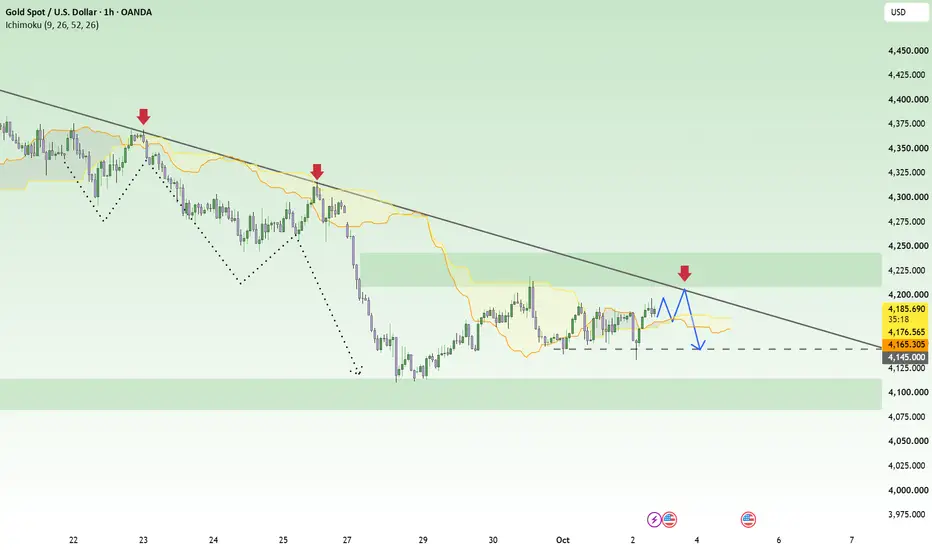
XAUUSD is entering a sensitive phase as the current recovery develops against a macro backdrop that remains challenging for gold. A firm U.S. dollar and elevated Treasury yields continue to reduce the relative appeal of non-yielding assets. Although expectations for a less hawkish Fed are providing some support, the market’s reaction suggests that capital flows have not shifted strongly enough to produce a convincing trend reversal. For that reason, I still view the current rebound as an opportunity to evaluate SELL positions at more favorable prices.
On the H1 chart, XAUUSD has recovered significantly from the 4,100 area, but the broader structure continues to be defined by a sequence of lower highs and a descending trendline overhead. More importantly, 4,205–4,240 is not simply a short-term resistance area; it is where the descending trendline converges with a previous supply zone. This is where the balance between buyers and sellers could begin to shift back in favor of supply, particularly if bullish momentum fades as price approaches the zone.
My preferred scenario is to allow XAUUSD to extend its recovery toward 4,205–4,240 before looking for SELL confirmation. A clear rejection from this area would reinforce the idea that the market is experiencing a corrective rally within a broader bearish structure. If supply returns, 4,145 becomes the first downside objective, followed by 4,100–4,115 if selling pressure continues to build.
In short, rather than selling at any price, I prefer to wait for the market to return to an area where sellers have a stronger advantage. With both the macro backdrop and H1 structure still pointing in the same direction, my approach remains SELL the rally — wait for the recovery, wait for confirmation, and follow the prevailing bearish structure.
On the H1 chart, XAUUSD has recovered significantly from the 4,100 area, but the broader structure continues to be defined by a sequence of lower highs and a descending trendline overhead. More importantly, 4,205–4,240 is not simply a short-term resistance area; it is where the descending trendline converges with a previous supply zone. This is where the balance between buyers and sellers could begin to shift back in favor of supply, particularly if bullish momentum fades as price approaches the zone.
My preferred scenario is to allow XAUUSD to extend its recovery toward 4,205–4,240 before looking for SELL confirmation. A clear rejection from this area would reinforce the idea that the market is experiencing a corrective rally within a broader bearish structure. If supply returns, 4,145 becomes the first downside objective, followed by 4,100–4,115 if selling pressure continues to build.
In short, rather than selling at any price, I prefer to wait for the market to return to an area where sellers have a stronger advantage. With both the macro backdrop and H1 structure still pointing in the same direction, my approach remains SELL the rally — wait for the recovery, wait for confirmation, and follow the prevailing bearish structure.
Trade closed: target reached

Want the full plan behind this analysis?
Free daily Forex, Gold, Crypto setups with reasoning
Entry, invalidation, targets and reviews
👉 Join free: t.me/+-HowPr1J4k03NGY1
Educational only. Not financial advice. Trading involves risk.
Free daily Forex, Gold, Crypto setups with reasoning
Entry, invalidation, targets and reviews
👉 Join free: t.me/+-HowPr1J4k03NGY1
Educational only. Not financial advice. Trading involves risk.
Related publications
Disclaimer
The information and publications are not meant to be, and do not constitute, financial, investment, trading, or other types of advice or recommendations supplied or endorsed by TradingView. Read more in the Terms of Use.
Want the full plan behind this analysis?
Free daily Forex, Gold, Crypto setups with reasoning
Entry, invalidation, targets and reviews
👉 Join free: t.me/+-HowPr1J4k03NGY1
Educational only. Not financial advice. Trading involves risk.
Free daily Forex, Gold, Crypto setups with reasoning
Entry, invalidation, targets and reviews
👉 Join free: t.me/+-HowPr1J4k03NGY1
Educational only. Not financial advice. Trading involves risk.
Related publications
Disclaimer
The information and publications are not meant to be, and do not constitute, financial, investment, trading, or other types of advice or recommendations supplied or endorsed by TradingView. Read more in the Terms of Use.