
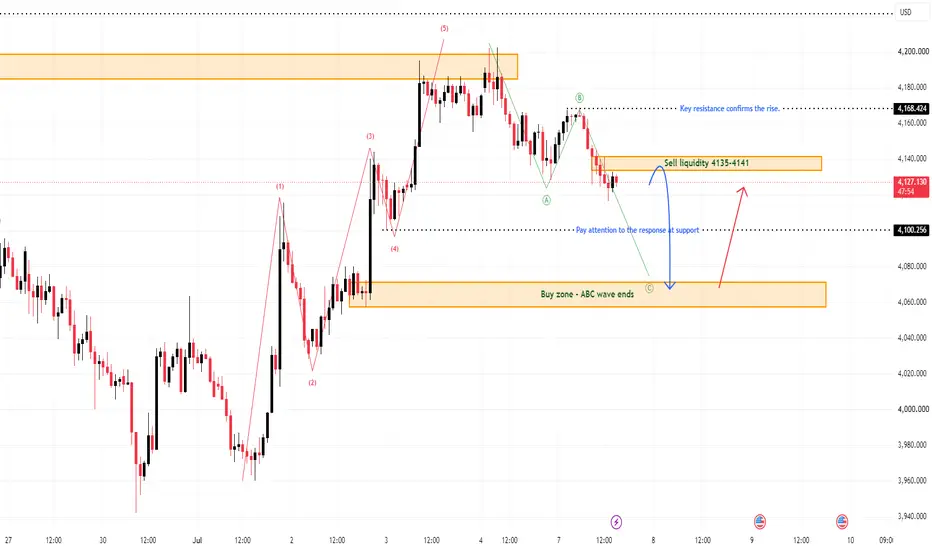
Gold is currently moving inside a corrective ABC structure after the previous strong bullish recovery. From Kelly’s view, price is now developing wave C lower, and the next important setup may appear only when this corrective wave finishes around the support zone.
The key idea is simple: gold is correcting now, but if wave C ends cleanly near support, buyers may step back in for the next recovery phase.
⟡ Market structure
The chart shows gold rejected from the upper resistance area after completing a strong upside move. Price then started to form an ABC correction, with wave A pulling lower, wave B reacting near resistance, and wave C now moving down towards the buy zone.
The current price is trading below the sell liquidity area around 4,135–4,141, which means short-term pressure still remains. However, the larger recovery structure has not fully failed yet because the main reaction zone below is still waiting near 4,060–4,075.
This area is important because it is marked as the zone where the ABC wave may end.
➤ Key levels
◌ 4,135–4,141: sell liquidity and short-term resistance
◌ 4,127: current reaction area
◌ 4,100: support response level to watch
◌ 4,060–4,075: buy zone and possible ABC wave C completion
◌ 4,168: key resistance confirming stronger recovery
◌ Below 4,060: area where the bullish recovery setup weakens
⌁ Elliott Wave view
From an Elliott Wave perspective, gold appears to be correcting after completing the previous bullish 5-wave movement.
Wave A created the first pullback from the high.
Wave B reacted higher but failed to break the key resistance.
Wave C is now developing lower towards the buy zone.
If wave C finishes around 4,060–4,075 and price prints a bullish confirmation candle, the ABC correction may be complete. From there, gold could begin a new recovery attempt back towards 4,135–4,141 first, then 4,168 if momentum improves.
▸ Trading scenario
Preferred scenario: wait for wave C to complete around the buy zone before looking for buy confirmation.
Entry zone: 4,060–4,075 if bullish confirmation appears
Stop loss: below the confirmed wave C low
Take profit 1: 4,100
Take profit 2: 4,135–4,141
Take profit 3: 4,168
Alternative scenario: if gold breaks below 4,060 with strong bearish pressure, the ABC buy setup weakens and price may need to search for a deeper support base before recovery can continue.
⌁ Kelly’s view
For Kelly, this is not a buy-now structure yet. Gold is still moving inside wave C, so patience is important.
The cleaner setup is to wait for price to complete the correction near the buy zone, then watch whether buyers defend that support with a clear reaction.
Gold is correcting inside wave C.
If the buy zone holds, the next recovery phase may start from there.
Share your view below.
The key idea is simple: gold is correcting now, but if wave C ends cleanly near support, buyers may step back in for the next recovery phase.
⟡ Market structure
The chart shows gold rejected from the upper resistance area after completing a strong upside move. Price then started to form an ABC correction, with wave A pulling lower, wave B reacting near resistance, and wave C now moving down towards the buy zone.
The current price is trading below the sell liquidity area around 4,135–4,141, which means short-term pressure still remains. However, the larger recovery structure has not fully failed yet because the main reaction zone below is still waiting near 4,060–4,075.
This area is important because it is marked as the zone where the ABC wave may end.
➤ Key levels
◌ 4,135–4,141: sell liquidity and short-term resistance
◌ 4,127: current reaction area
◌ 4,100: support response level to watch
◌ 4,060–4,075: buy zone and possible ABC wave C completion
◌ 4,168: key resistance confirming stronger recovery
◌ Below 4,060: area where the bullish recovery setup weakens
⌁ Elliott Wave view
From an Elliott Wave perspective, gold appears to be correcting after completing the previous bullish 5-wave movement.
Wave A created the first pullback from the high.
Wave B reacted higher but failed to break the key resistance.
Wave C is now developing lower towards the buy zone.
If wave C finishes around 4,060–4,075 and price prints a bullish confirmation candle, the ABC correction may be complete. From there, gold could begin a new recovery attempt back towards 4,135–4,141 first, then 4,168 if momentum improves.
▸ Trading scenario
Preferred scenario: wait for wave C to complete around the buy zone before looking for buy confirmation.
Entry zone: 4,060–4,075 if bullish confirmation appears
Stop loss: below the confirmed wave C low
Take profit 1: 4,100
Take profit 2: 4,135–4,141
Take profit 3: 4,168
Alternative scenario: if gold breaks below 4,060 with strong bearish pressure, the ABC buy setup weakens and price may need to search for a deeper support base before recovery can continue.
⌁ Kelly’s view
For Kelly, this is not a buy-now structure yet. Gold is still moving inside wave C, so patience is important.
The cleaner setup is to wait for price to complete the correction near the buy zone, then watch whether buyers defend that support with a clear reaction.
Gold is correcting inside wave C.
If the buy zone holds, the next recovery phase may start from there.
Share your view below.

📌 New analysis published daily
🔔 Follow this profile for real-time updates
⚠️ This is personal analysis, not financial advice
Daily GOLD and Forex updates: t.me/+SOSI26CZOJ1mZDhl
🔔 Follow this profile for real-time updates
⚠️ This is personal analysis, not financial advice
Daily GOLD and Forex updates: t.me/+SOSI26CZOJ1mZDhl
Disclaimer
The information and publications are not meant to be, and do not constitute, financial, investment, trading, or other types of advice or recommendations supplied or endorsed by TradingView. Read more in the Terms of Use.
📌 New analysis published daily
🔔 Follow this profile for real-time updates
⚠️ This is personal analysis, not financial advice
Daily GOLD and Forex updates: t.me/+SOSI26CZOJ1mZDhl
🔔 Follow this profile for real-time updates
⚠️ This is personal analysis, not financial advice
Daily GOLD and Forex updates: t.me/+SOSI26CZOJ1mZDhl
Disclaimer
The information and publications are not meant to be, and do not constitute, financial, investment, trading, or other types of advice or recommendations supplied or endorsed by TradingView. Read more in the Terms of Use.