
## **Market Overview**
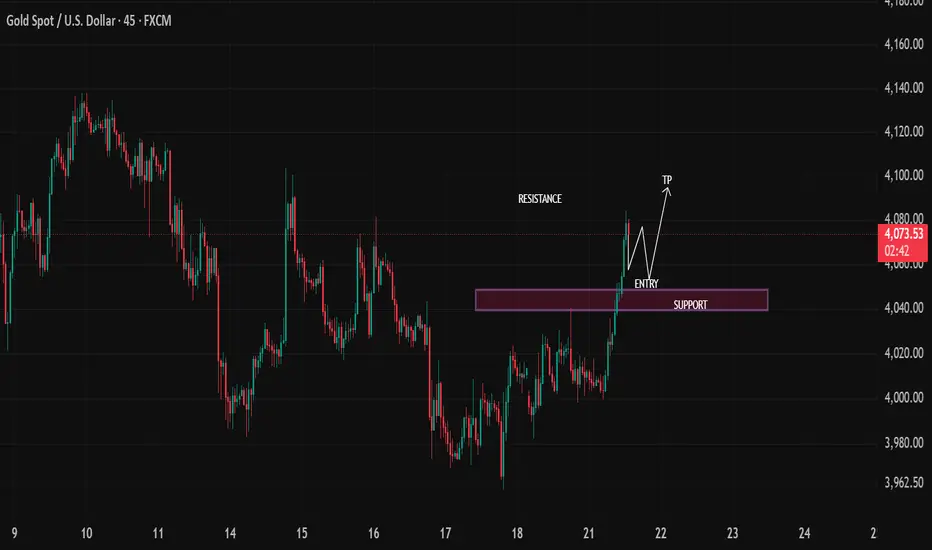
Gold has shifted from a short-term consolidation into a bullish impulse after breaking above a well-defined support/resistance zone. The strong bullish candles indicate buyers are currently in control, while the highlighted purple zone is likely to act as a demand area if price retraces.
The overall market structure has changed from **lower highs and lower lows** to **higher highs and higher lows**, suggesting increasing bullish momentum.
---
## **Market Structure**
* **Trend:** Short-term Bullish
* **Momentum:** Strong bullish breakout
* **Bias:** Buy on Pullback
Price has successfully broken above the previous resistance zone, which now has the potential to become new support. This is a classic **break-and-retest** setup often seen before continuation moves.
---
## **Key Technical Levels**
### **Resistance**
* **4,078 – 4,082**
* This is the immediate resistance where price is currently reacting.
* A confirmed breakout above this level could trigger another bullish expansion.
### **Support / Demand Zone**
* **4,035 – 4,045**
* Previously acted as resistance.
* Now expected to provide buying interest during a retracement.
* This area aligns with the highlighted purple zone.
---
## **Trading Scenario**
### **Preferred Setup: Buy on Pullback**
Wait for price to retrace into the **4,035–4,045** support zone.
Look for:
* Bullish rejection candles
* Bullish engulfing pattern
* Strong buying volume
* Higher low formation
Only enter after confirmation rather than placing a blind limit order.
---
## **Target Levels**
### **Entry**
* Around **4,040** after bullish confirmation.
### **Take Profit 1**
* **4,080**
### **Take Profit 2**
* **4,095**
### **Take Profit 3**
* **4,105**
If momentum remains strong, an extension toward **4,120** cannot be ruled out.
---
## **Risk Management**
**Suggested Stop Loss**
* Below **4,030**
* Conservative traders may place it below the recent swing low near **4,020**.
Aim for a **minimum Risk-to-Reward ratio of 1:2**, with **1:3 or better** preferred if targeting the higher resistance levels.
---
## **Bullish Confirmation**
The bullish outlook remains valid if:
* Price holds above the support zone.
* Higher lows continue to form.
* Buyers defend the breakout area.
---
## **Invalidation Scenario**
The bullish setup becomes weaker if:
* Price closes decisively below **4,035**.
* The breakout fails and price returns below the demand zone.
* Selling pressure produces a new lower low beneath the recent swing structure.
In that case, the market could revisit the **4,020–4,000** region before attempting another upward move.
---
# **Professional Outlook**
The chart presents a **high-probability bullish continuation setup**. Rather than chasing the breakout, the higher-probability approach is to **wait for a pullback into the former resistance (now support) zone**, then seek bullish price action confirmation before entering. If buyers successfully defend this area, the path toward **4,095–4,105** becomes increasingly favorable.
Gold has shifted from a short-term consolidation into a bullish impulse after breaking above a well-defined support/resistance zone. The strong bullish candles indicate buyers are currently in control, while the highlighted purple zone is likely to act as a demand area if price retraces.
The overall market structure has changed from **lower highs and lower lows** to **higher highs and higher lows**, suggesting increasing bullish momentum.
---
## **Market Structure**
* **Trend:** Short-term Bullish
* **Momentum:** Strong bullish breakout
* **Bias:** Buy on Pullback
Price has successfully broken above the previous resistance zone, which now has the potential to become new support. This is a classic **break-and-retest** setup often seen before continuation moves.
---
## **Key Technical Levels**
### **Resistance**
* **4,078 – 4,082**
* This is the immediate resistance where price is currently reacting.
* A confirmed breakout above this level could trigger another bullish expansion.
### **Support / Demand Zone**
* **4,035 – 4,045**
* Previously acted as resistance.
* Now expected to provide buying interest during a retracement.
* This area aligns with the highlighted purple zone.
---
## **Trading Scenario**
### **Preferred Setup: Buy on Pullback**
Wait for price to retrace into the **4,035–4,045** support zone.
Look for:
* Bullish rejection candles
* Bullish engulfing pattern
* Strong buying volume
* Higher low formation
Only enter after confirmation rather than placing a blind limit order.
---
## **Target Levels**
### **Entry**
* Around **4,040** after bullish confirmation.
### **Take Profit 1**
* **4,080**
### **Take Profit 2**
* **4,095**
### **Take Profit 3**
* **4,105**
If momentum remains strong, an extension toward **4,120** cannot be ruled out.
---
## **Risk Management**
**Suggested Stop Loss**
* Below **4,030**
* Conservative traders may place it below the recent swing low near **4,020**.
Aim for a **minimum Risk-to-Reward ratio of 1:2**, with **1:3 or better** preferred if targeting the higher resistance levels.
---
## **Bullish Confirmation**
The bullish outlook remains valid if:
* Price holds above the support zone.
* Higher lows continue to form.
* Buyers defend the breakout area.
---
## **Invalidation Scenario**
The bullish setup becomes weaker if:
* Price closes decisively below **4,035**.
* The breakout fails and price returns below the demand zone.
* Selling pressure produces a new lower low beneath the recent swing structure.
In that case, the market could revisit the **4,020–4,000** region before attempting another upward move.
---
# **Professional Outlook**
The chart presents a **high-probability bullish continuation setup**. Rather than chasing the breakout, the higher-probability approach is to **wait for a pullback into the former resistance (now support) zone**, then seek bullish price action confirmation before entering. If buyers successfully defend this area, the path toward **4,095–4,105** becomes increasingly favorable.

JOIN MY TELEGRAM CHANNEL FREE :
t.me/SMARTPROFITHUB2
t.me/SMARTPROFITHUB2
Disclaimer
The information and publications are not meant to be, and do not constitute, financial, investment, trading, or other types of advice or recommendations supplied or endorsed by TradingView. Read more in the Terms of Use.
JOIN MY TELEGRAM CHANNEL FREE :
t.me/SMARTPROFITHUB2
t.me/SMARTPROFITHUB2
Disclaimer
The information and publications are not meant to be, and do not constitute, financial, investment, trading, or other types of advice or recommendations supplied or endorsed by TradingView. Read more in the Terms of Use.