
October 12: Gold Price Trend Analysis for Monday
For gold to stage a reversal, a new catalyst—such as fresh news or data—is required. Currently, rising U.S. Treasury yields remain the primary headwind for gold. However, if monetary policy continues to tighten, it could drag down the economy and exacerbate U.S. fiscal pressures; given the persistently high debt levels, safe-haven demand for gold would naturally emerge in such a scenario.
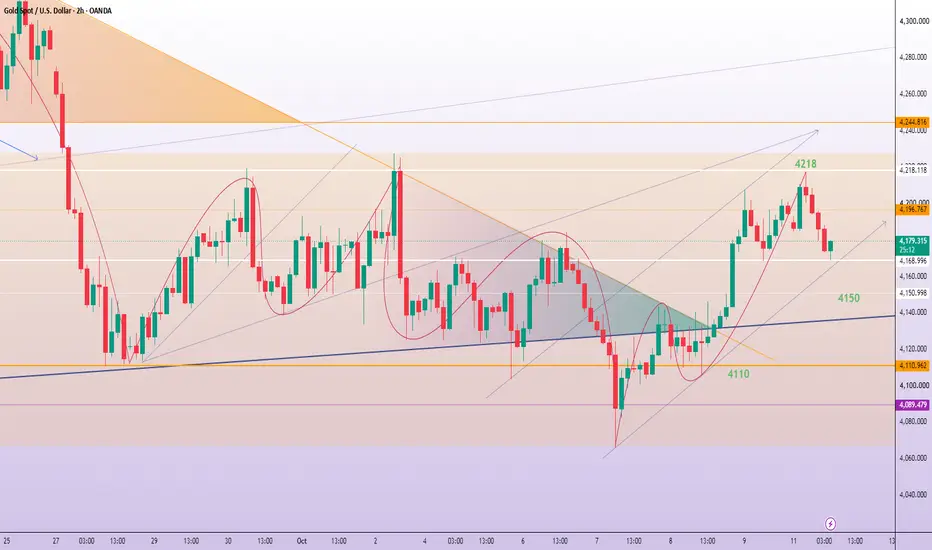
As shown in the 2-hour chart, a short-term resistance high has formed in the 4217–4220 zone. Prices are currently in a pullback phase; until this strong resistance is broken, it is best to avoid blindly chasing long positions and instead focus on going long following a pullback.
Key resistance levels to watch: 4196–4200, with 4217–4220 serving as a critical resistance zone.
Key support levels: 4150–4160 (an area where previous resistance has turned into support);
Important support level: 4110.
If the price falls below 4150, a further pullback to 4110 is possible;
If the price holds above 4150, it may retest the 4196–4200 range.
Trading Strategy
Key levels to watch:
Support zone: 4150–4160;
Resistance zone: 4196–4200.
Short-selling strategy:
If the price rebounds to the 4196–4200 range and shows signs of stalling or pulling back after the rally, consider a light short position;
Target: 4160–4150;
Stop-loss: Above 4210.
Long strategy:
If the price pulls back to the 4150–4160 range and stabilizes, consider going long;
Target: 4196–4200;
Stop-loss: Below 4140.
If the price breaks above 4200 with significant volume and holds, look for a rise to 4217–4245.
For gold to stage a reversal, a new catalyst—such as fresh news or data—is required. Currently, rising U.S. Treasury yields remain the primary headwind for gold. However, if monetary policy continues to tighten, it could drag down the economy and exacerbate U.S. fiscal pressures; given the persistently high debt levels, safe-haven demand for gold would naturally emerge in such a scenario.
As shown in the 2-hour chart, a short-term resistance high has formed in the 4217–4220 zone. Prices are currently in a pullback phase; until this strong resistance is broken, it is best to avoid blindly chasing long positions and instead focus on going long following a pullback.
Key resistance levels to watch: 4196–4200, with 4217–4220 serving as a critical resistance zone.
Key support levels: 4150–4160 (an area where previous resistance has turned into support);
Important support level: 4110.
If the price falls below 4150, a further pullback to 4110 is possible;
If the price holds above 4150, it may retest the 4196–4200 range.
Trading Strategy
Key levels to watch:
Support zone: 4150–4160;
Resistance zone: 4196–4200.
Short-selling strategy:
If the price rebounds to the 4196–4200 range and shows signs of stalling or pulling back after the rally, consider a light short position;
Target: 4160–4150;
Stop-loss: Above 4210.
Long strategy:
If the price pulls back to the 4150–4160 range and stabilizes, consider going long;
Target: 4196–4200;
Stop-loss: Below 4140.
If the price breaks above 4200 with significant volume and holds, look for a rise to 4217–4245.
Trade active

Technical and fundamental market analysis
Educational insights and trading strategies
Join now for disciplined trading.
t.me/+qnqZW1FWCGI5YzNh
Educational insights and trading strategies
Join now for disciplined trading.
t.me/+qnqZW1FWCGI5YzNh
Disclaimer
The information and publications are not meant to be, and do not constitute, financial, investment, trading, or other types of advice or recommendations supplied or endorsed by TradingView. Read more in the Terms of Use.
Technical and fundamental market analysis
Educational insights and trading strategies
Join now for disciplined trading.
t.me/+qnqZW1FWCGI5YzNh
Educational insights and trading strategies
Join now for disciplined trading.
t.me/+qnqZW1FWCGI5YzNh
Disclaimer
The information and publications are not meant to be, and do not constitute, financial, investment, trading, or other types of advice or recommendations supplied or endorsed by TradingView. Read more in the Terms of Use.