
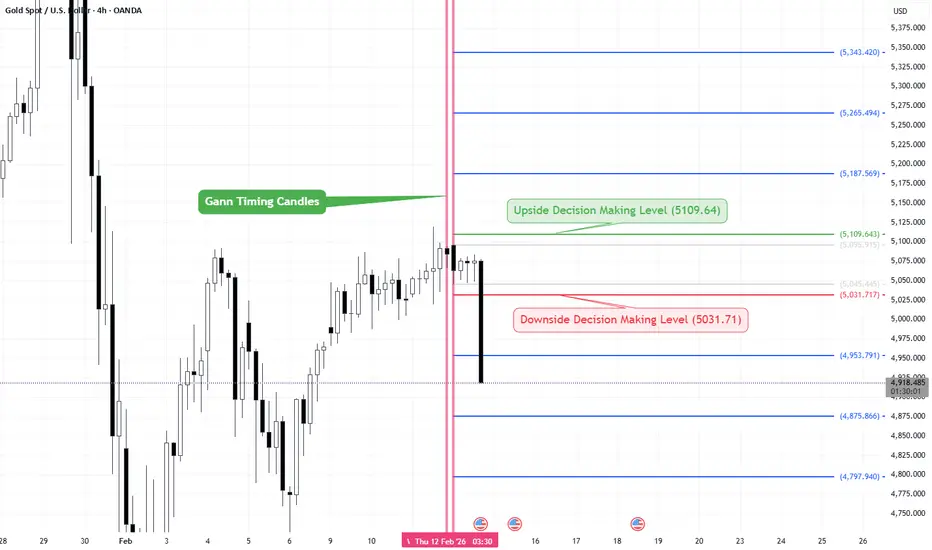
- Gann Time Cycles have been plotted and highlighted with vertical lines. These mark the key candles to watch.
- The combined high and low of these important candles are marked, with a minor buffer added to reduce the risk of false breakouts.
Resistance Setup
- Green Line – 5109.64 → Resistance level
- If a candle closes above 5109.64, expect upward momentum.
- Stoploss: Red Line – 5031.71
- Targets: Sequential Blue Lines
Support Setup
- Red Line – 5031.71 → Support level
- If a candle closes below 5031.71, expect downward momentum.
- Stoploss: Green Line – 5109.64
- Targets: Sequential Blue Lines
- The combined high and low of these important candles are marked, with a minor buffer added to reduce the risk of false breakouts.
Resistance Setup
- Green Line – 5109.64 → Resistance level
- If a candle closes above 5109.64, expect upward momentum.
- Stoploss: Red Line – 5031.71
- Targets: Sequential Blue Lines
Support Setup
- Red Line – 5031.71 → Support level
- If a candle closes below 5031.71, expect downward momentum.
- Stoploss: Green Line – 5109.64
- Targets: Sequential Blue Lines

Disclaimer
The information and publications are not meant to be, and do not constitute, financial, investment, trading, or other types of advice or recommendations supplied or endorsed by TradingView. Read more in the Terms of Use.
Disclaimer
The information and publications are not meant to be, and do not constitute, financial, investment, trading, or other types of advice or recommendations supplied or endorsed by TradingView. Read more in the Terms of Use.